
A website can fail in a hundred different ways, and many of them are quiet.
Sometimes it is obvious, like a full outage. Sometimes it is subtle, like a checkout button that stops working for Safari users, or a performance regression that makes your site feel "just a bit slower" after a release. Those quiet failures are exactly why tracking the right website metrics matters.
This article walks through the essential metrics every business should track, grouped by what they actually protect:
- Revenue (sales and leads)
- Reputation (trust and professionalism)
- SEO (visibility and crawlability)
- Operations (your team's ability to detect and fix issues quickly)
It includes the metrics Semonto monitors well, such as website monitoring, HTTPS/TLS checks, broken link monitoring, mixed content monitoring, Lighthouse monitoring, domain monitoring, content monitoring, server health monitoring, and cron job monitoring. It also covers uptime reports and notifications. Beyond that, consider adding metrics from other tools (JavaScript exceptions, real user Core Web Vitals, application error rates, conversion funnels, and more).
Start with a simple idea: metrics should answer business questions
Before you track anything, decide what you want to be true.
A practical framework is to track metrics that answer these five questions:
- Can people reach us? (availability and reachability)
- Does it feel fast and stable? (performance and UX)
- Does it work end to end? (key journeys like login, checkout, forms)
- Is it trustworthy? (security signals and integrity)
- Is it achieving outcomes? (conversions, revenue, leads, signups)
The goal is not to collect data. The goal is to reduce unpleasant surprises.
Two types of website metrics: synthetic checks vs real user data
A lot of confusion comes from mixing two fundamentally different measurement styles.
Synthetic monitoring (lab style checks)
A tool loads a page or calls an endpoint on a schedule from one or more locations. This is excellent for catching regressions quickly and for uptime and reachability. Semonto's website monitoring is primarily in this category.
Real User Monitoring (RUM, field data)
Metrics are collected from actual visitors in real browsers on real devices and networks. This is crucial for understanding true user experience. Google explicitly distinguishes lab data from field data in the Core Web Vitals ecosystem.
The best setups use both: synthetic to detect issues early and consistently, and RUM to confirm real impact and prioritize fixes.
The essential website metrics to track
1. Uptime and reachability
What to track
- Uptime percentage (per month, per quarter)
- Total downtime minutes
- Number of incidents and incident duration
- Reachability from multiple regions
- Slow responses (timeouts or degraded performance)
Why it matters
If the site is unavailable, everything else is irrelevant. Uptime is your baseline heartbeat metric.
How to measure
Use a monitoring tool that checks your site continuously and alerts you quickly.
Semonto's website monitoring checks whether your website is unreachable or slow to respond, and it validates results from multiple locations to reduce false positives. For location-based reachability checks, see how to check availability from different countries.
Practical tip
Do not only monitor the homepage. Monitor:
- Your most important landing pages
- The login page
- Key transactional pages (cart, checkout, contact form)
- Critical API endpoints (if you have an app). See server monitoring.
2. Response time and latency
What to track
- Average response time (useful, but incomplete)
- Percentiles (p95 or p99) for response time
- Timeouts and degraded performance events
Why it matters
Many outages start as slowdowns. Users experience this as frustration, abandonment, and support tickets.
How to measure
Synthetic monitoring tools can alert when endpoints get slow. Semonto's website monitoring includes alerts for slow responses.
Practical tip
Use different thresholds for different pages. A blog post can tolerate slower responses than checkout.
3. HTTP status codes and error rate
What to track
- 5xx error rate (server side failures)
- 4xx error rate on important pages (broken routes, authorization issues, WAF blocks)
- Sudden changes in status code mix after deployments
Why it matters
HTTP codes are the simplest "is this request healthy?" signal you can get. They also matter for SEO and integrations.
Reference baseline
HTTP status codes are grouped into classes: 2xx success, 3xx redirects, 4xx client errors, 5xx server errors. MDN's HTTP status reference is the best quick lookup.
How to measure
- Synthetic monitoring catches outright 500 or 503 style failures.
- Logs and APM tools are better for error rate trends and root cause analysis.
- Broken link monitoring helps you find sources of 404s before users do.
- Semonto's reachability test validates the HTTP status code by default. If your website returns an error code, Semonto will spot it and alert you.
Practical tip
Track 404s separately:
- 404s caused by broken internal links (your responsibility)
- 404s caused by old external links or changed URLs (needs redirect strategy)
If you need a refresher, see what a 404 error is and why it matters.
4. Core Web Vitals and performance quality
Performance is not one number. It is multiple signals, and two kinds of data.
The Core Web Vitals you should track (field metrics)
Google's Core Web Vitals are:
- LCP (Largest Contentful Paint): loading experience
- INP (Interaction to Next Paint): responsiveness
- CLS (Cumulative Layout Shift): visual stability
Google also publishes thresholds for what counts as "good" in the Core Web Vitals documentation.
Field data vs lab data
Field data is based on real world usage. Search Console's Core Web Vitals report uses field data. See the Search Console Core Web Vitals report and the Chrome User Experience Report (CrUX) for datasets built on real usage.
PageSpeed Insights uses CrUX for real user data and reports it over a previous collection window (often presented as a 28 day period). The PageSpeed Insights documentation explains how those windows work.
Lighthouse audits (lab style checks)
Lighthouse is an automated auditing tool that evaluates pages across categories like performance, accessibility, SEO, and more. The Lighthouse overview explains how lab audits differ from real user data.
Semonto automates Lighthouse monitoring and alerts on score drops. If you want a walkthrough, see how to monitor Lighthouse scores with Semonto.
Why it matters
- Field data tells you what users really experience.
- Lighthouse tells you what to fix and helps you catch regressions soon after releases.
How to measure
- Use field data from Search Console, CrUX, or a RUM tool to understand real user Core Web Vitals.
- Use Lighthouse audits for lab metrics and regression detection.
- Semonto's Lighthouse monitoring runs automatically on the pages you specify, so you can track Core Web Vitals lab metrics (LCP, INP, CLS) for multiple key pages out of the box.
Practical tip
Track performance at two levels:
- Business critical pages (home, top landing pages, checkout)
- Templates (one representative page per template type)
Also monitor performance periodically. It can degrade over time due to external factors like a slower CDN, third-party script changes, or infrastructure shifts that seem unrelated at first glance.
5. JavaScript exceptions and front end errors
This is the metric many businesses miss, especially if they only track uptime.
A site can return HTTP 200 and still be broken for users due to front end failures:
- Uncaught JavaScript exceptions
- Unhandled promise rejections
- Failed script loads, failed CSS loads, blocked third party resources
- SPA route errors that render blank screens
What to track
- JavaScript error rate (errors per pageview or per session)
- Number of affected users
- Top error messages and top stack traces
- Errors by browser, device, and version
- New errors per release
Why it matters
Most users will not report a front end error. They will simply leave.
How to measure
This is usually handled by front end error monitoring tools or RUM platforms.
Technical detail: the browser window.onerror handler fires when an uncaught JavaScript error occurs, and you also need unhandledrejection to capture unhandled promise rejections. See Sentry's overview of client-side error reporting.
RUM solutions can capture JavaScript errors and provide context like the affected page and user journey. This Dynatrace guide on JavaScript error monitoring is a solid reference.
If you are debugging blank screens, our guide on why websites show a blank page can help with root causes.
Practical tip
If you have a marketing site with a few scripts, tracking JavaScript errors is still worthwhile. If you have a web app or webshop, it is non negotiable.
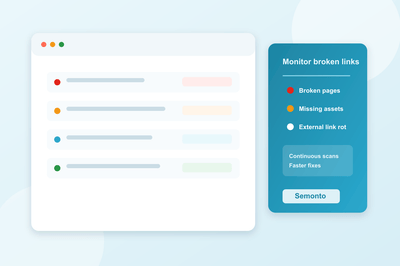
6. Broken links, broken pages, and missing assets
What to track
- Number of broken internal links
- Number of broken external links (and where they are referenced)
- Broken images and missing files
- Trends over time (are broken links increasing after content updates?)
Why it matters
Broken links are a user trust killer, a conversion killer, and often an SEO problem.
How to measure
Semonto provides broken link monitoring that checks your website continuously and reports broken links, including where the link is located and why it failed. It also identifies broken images (image URLs that return error codes).
Practical tip
Treat broken links differently depending on where they happen:
- Homepage or navigation links: urgent
- Old blog post references: medium priority
- External links to third party sites: fix if important, otherwise accept
If you want a playbook, see how to prevent 404 errors on your website.
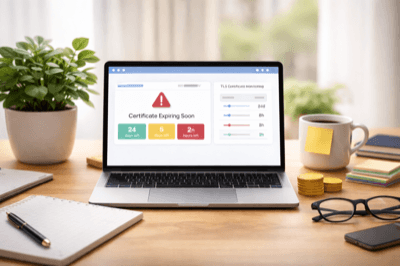
7. SSL and TLS certificate health
What to track
- Days until certificate expiry
- Certificate validity and trust chain correctness
- Hostname mismatch
- Revocation status (OCSP and CRL)
- Any sudden certificate changes
Why it matters
TLS failures trigger browser warnings and break trust instantly. They can also interfere with crawling and indexing.
Semonto's HTTPS certificate monitoring covers common failure scenarios like expired certificates, hostname mismatch, incomplete chains, and revoked certificates (via OCSP and CRL checks). For background, read why TLS/SSL certificates are getting shorter lifespans.
Practical tip
Do not only monitor the main domain. Monitor:
wwwand nonwww- API subdomains
- CDN hostnames you control
- Checkout or payment subdomains (if applicable)
8. Mixed content and security warnings
Mixed content means a page is loaded over HTTPS but pulls some resources over HTTP (images, scripts, iframes, and so on). That undermines security signals and can cause browsers to warn or block resources.
What to track
- Number of mixed content issues
- Pages affected
- Whether the mixed content is passive (image) or active (script)
Semonto's mixed content monitoring checks for these issues and alerts you when mixed content appears. You can also run a quick scan with the free mixed content checker.
Practical tip
Treat active mixed content (scripts, iframes) as urgent. It can become a real security incident.
9. Domain expiry and domain changes
Domain related failures are catastrophic and completely avoidable.
What to track
- Days until domain expiry
- Unexpected changes to DNS, nameservers, or registrant details
- Changes to mail related DNS records (if email delivery matters)
Semonto's domain monitoring warns in advance when a domain is about to expire and also flags unexpected changes. If you need to confirm which TLDs are supported, see the supported domains list.
Practical tip
Domain monitoring should include the domains you use for:
- Your website
- Transactional emails
- Landing pages for campaigns
- Redirect domains (often forgotten)
10. Content integrity and silent failures
Sometimes the page loads, but the content is wrong:
- A pricing page loses the price block
- A tracking pixel disappears
- A hacked site replaces text
- A server returns a blank page but still returns 200 OK
What to track
- Required content presence (critical phrases, scripts, pixels)
- Forbidden content (error messages, "not found" text)
- Unexpected page changes
Semonto's content monitoring alerts when required content is missing or forbidden content appears. To set this up, see how to check for forbidden or required content.
Practical tip
Content checks are a strong complement to uptime checks because they catch "looks up but is broken" situations.
11. Cron jobs and background processes
Many businesses rely on background tasks:
- Backups
- Feed imports
- Scheduled emails
- Invoice generation
- Inventory updates
- Cache warming
When these fail, the website might look fine until the business process breaks.
What to track
- Job success rate
- Missed runs
- Job duration (advanced)
- Queue backlog (advanced)
Semonto's cron job monitoring works by having your script ping a unique URL, and it alerts you when the pulse stops, meaning the job likely failed or stopped running. See how to set up cron job monitoring for a walkthrough.
Practical tip
Make critical cron jobs observable. A silent failure is often more damaging than an obvious one.
12. Server and infrastructure health
Even if you use managed hosting, you still benefit from basic infrastructure metrics.
What to track
- Disk space
- Load average
- Memory usage
- CPU usage
- Temperature (where applicable)
- Swap usage
Semonto's server health monitoring tracks common infrastructure signals like disk space, load average, memory usage, CPU usage, temperature, and more. The server health monitoring guide explains thresholds and setup.
Practical tip
Define thresholds and trends. "Disk space at 90 percent" is an alert. "Disk space rising 2 percent per day" is a planning signal.
13. Conversion and funnel metrics
Technical metrics keep you safe. Funnel metrics keep you honest.
What to track
- Conversion rate (purchase, lead, signup)
- Checkout completion rate
- Form submission success rate
- Funnel drop off at each step
- Revenue per session (if relevant)
Why it matters
A website can be up and fast, and still be failing the business goal.
How to measure
This typically lives in analytics platforms and product analytics tools, plus server side logging for success events (purchase completed, form accepted).
If you are creative, you can define custom tests in health endpoint monitoring, part of our server health monitoring. It is something we use internally at Semonto as well.
Practical tip
Tie technical incidents to funnel metrics. If conversions drop, your first question should be: "Did anything break?"
14. SEO visibility and crawl health
SEO is not only keywords. It is also technical stability and crawlability.
What to track
- Search impressions and clicks
- Indexing issues and crawl errors
- Core Web Vitals status
- Sudden drops in top landing page traffic
Google Search Console helps monitor and troubleshoot your site's presence in Google Search, including indexing problems, search traffic, and alerts for issues like security problems. See Search Console's overview.
Semonto supports SEO-related monitoring via Lighthouse monitoring, broken link monitoring, mixed content monitoring, and HTTPS monitoring.
15. Alerting quality and incident response metrics
Tracking metrics is not enough. You need a way to respond consistently.
What to track
- MTTD (Mean Time To Detect)
- MTTR (Mean Time To Resolve)
- Alert volume (noise)
- Escalation effectiveness
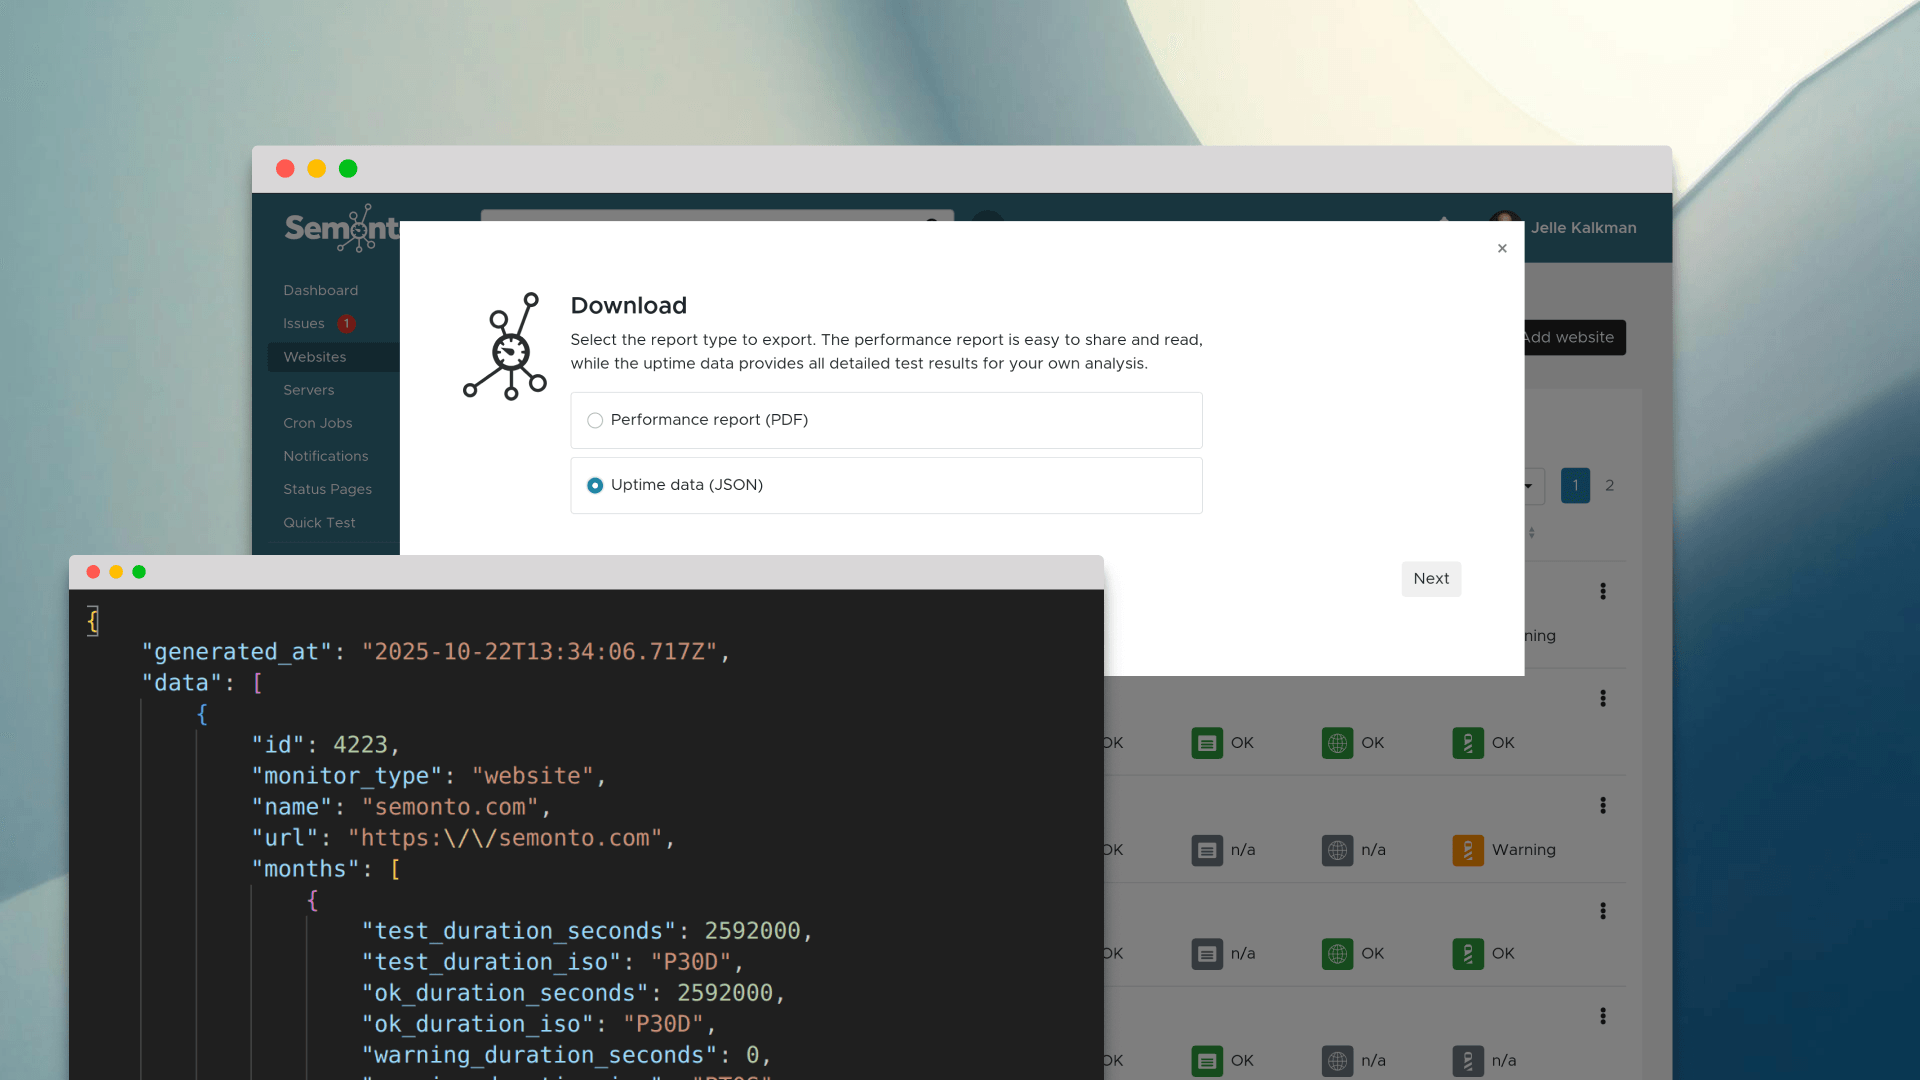
Semonto supports configurable notifications via uptime and downtime notifications, plus escalation processes to reduce noise. It also provides status pages to keep customers and partners informed, and issue management for tracking incidents internally. For notification setup, see the notifications guide.
Practical tip
Treat alerting as a product feature for your team. If alerts are noisy or unclear, people stop trusting them.
A practical starter set of metrics
If you want a minimal set that covers most business risk, start here.
Must alert immediately
- Uptime and reachability
- Slow response time on key pages
- SSL and TLS validity and expiry
- Domain expiry
- Mixed content (especially scripts and iframes)
- Broken checkout or contact page links
- Major JavaScript exception spikes (for apps and webshops)
Review weekly
- Lighthouse trends on key pages
- Broken link trends
- Content integrity checks (required and forbidden phrases)
- Server health trends (disk, memory, load)
Review monthly with stakeholders
- Uptime report and incidents
- Core Web Vitals field data (Search Console)
- Funnel conversion trends and drop off points
- Top issues list and what was improved
Final thought: your monitoring stack should match your business model
A brochure site, a lead gen site, and a webshop should not have identical dashboards.
But they should all answer the same fundamental question: is the website reliably producing the outcome the business expects?
Semonto covers a large part of the external health layer: uptime, reachability, SSL and TLS, domain changes, mixed content, broken links, Lighthouse audits, content monitoring, cron jobs, server health, and incident workflows like notifications, reporting and status pages. Learn more about Semonto.
To go beyond that, add tools for RUM field metrics and client side error tracking, especially for modern JavaScript heavy sites. See Web Vitals measurement guidance.
When you combine those layers, you get something rare and valuable: confidence.
Latest blogs
Tips and Tricks
How to Monitor Broken Links: 12 SEO Best Practices (2026)
Tips and Tricks
Monitoring Short-Lived TLS Certificates with Semonto
New