How to monitor server health with Semonto
Prevent downtime by keeping an eye on the health of your servers

Contents
Server health monitoring allows you to prevent downtime by keeping an eye on your server at all times. Define what aspects of your server you want to monitor, and Semonto will notify you when an issue needs your attention.
This article will show you exactly how to get started.
What is the benefit of a server health monitor?
Semonto’s reachability feature checks if a given URL is reachable, verifies the HTTP server result code and whether your website loads. With a server health monitor, we go deeper behind the scenes and can test the server load, disk space and server usage in more detail. You can also write custom tests to reflect when your server and web application are in good condition or have some issues. For example, you could check the status of queues, process application logs and more.
How do server health checks work?
If you want to monitor the health of a server, you first need access to that server. This is why you create a server health point, also known as a health check URL or health endpoint. It acts as a portal for external monitoring. The server will perform tests and return the status of these tests through a secure URL that you have created, for example, https://myserver/health. Optionally, and depending on your settings, it can also provide some extra data about the results when requested.
What type of servers are supported?
In theory, all types of servers are supported. Semonto calls the server health endpoint and processes the answer. Your server is responsible for performing and executing all the tests. When setting up the test, select the framework that corresponds with the software stack you already have on your server and are using for your websites or web applications. This will ensure that your current stack is performing as expected. Semonto supports multiple frameworks and plugins, going from PHP and Laravel to Python and platforms like WordPress and Drupal. As we use standard communication methods, server OSs like Windows and all Linux distributions such as Debian and Ubuntu are also supported.
How to create a server health endpoint
Getting started with server health checking is a two-step process.
- First, you need to set up a server health endpoint on the server.
- Secondly, you enable and configure the monitoring in Semonto
As explained, the health endpoint will perform the tests on the server and return its health status. There is no official standard for this, and it is usually done via the HTTP status code.
The status code should be 200 when the server is healthy and higher than 400 when something is wrong. HTTP 200 is the “All OK” code. See our docs about the most common website and serve errors.
Additionally, some health endpoints return extra metadata to give more insight into the server condition, such as the current RAM usage, disk usage, server load, state of queues and so on. Semonto has extended support for both.
First step: Create the health endpoint on the server
You can create and implement your own health endpoint or use existing frameworks, plugins, or modules. Ideally, you use a system that is identical to the software stack that is already running on your server and is used for your web application on the server.
Health endpoints typically run on a /status or /health directory, but that is not enforced by Semonto, so you can use any URL and location you prefer, as long as Semonto can reach it.
Possible health endpoints you can use:
Semonto framework: The Semonto framework is developed for PHP 7.4 and higher and should run on all PHP servers. The framework exposes a set of default health tests and gives you an interface to add custom tests easily. See here for more information.
Semonto WordPress plugin: Use our Semonto WordPress Health plugin available from the plugin store
Laravel-health: See Spatie how to install this package on your Laravel server. Make sure that the secret key matches the configured secret key on your Laravel server and the header name is set to
oh-dear-health-check-secret.Drupal Health Check URL: If you use Health Check Url you can select in Semonto the “Drupal Health Check Url” endpoint type. Be sure to configure the plugin to return "passed" if everything is OK.
Drupal Health Check and other Drupals: If you use Health check or another plugin for the server health. Be sure to select in Semonto the “HTTP Status code only”, as those endpoints do not return extra metadata, but will return the status via the HTTP Code.
WordPress: Plugin Health Endpoint is compatible with Semonto if the "HTTP Status code only" option from the endpoint types is used.
Other frameworks: If you use another framework that is not listed here, there are two options:
- If the server returns a HTTP status code corresponding with the server status, it should work by using the “HTTP Status Code Only”
- If your server returns the health status in plain text format you can use our content checker to monitor the server health however this test is limited to 2 hour intervals.
If the framework returns more technical information and has support for multiple tests, please get in touch with our support team, as we can maybe easily add support for this framework.
Creating your own health endpoint
As a fallback, or if you do not trust existing frameworks, you can create your own health endpoint. This could simply use the HTTP code to return the status of your server. HTTP 200 when everything is OK, or an HTTP 500 when something bad is going on. Be sure to select “HTTP Status Code Only” in Semonto in this case.
More detailed test results
If you want to also return more detailed test information, your endpoint should return a JSON that matches some requirements. The easiest to implement will be the Semonto Health Framework.
If you want to be compatible with our Semonto health format, keep the following in mind.
- There are three levels: ok, warning and error for each test.
- In the JSON file, the global status must be present in the root as a “status” key.
- Each test result could be added to the array found in the key “results”.
- For each test result, the key “status” and the key “name” are required.
The allowed values for status are: “ok”, “warning”, and “error”.
The name can be anything you want.
The key “description” should be used for more info about the test results.
The key “value” should be a numerical value. For example, the amount of used memory in the example below.
{
  "results": [
    {
        "name": "Current load",
        "description": "Load: 0",
        "value": 0,
        "status": "ok"
    }, {
        "name": "Load average 5 min",
        "description": "Load average: 0",
        "value": 0,
        "status": "ok"
    }, {
        "name": "Load average 15 min",
        "description": "Load average: 0",
        "value": 0,
        "status": "ok"
    }, {
        "name": "MySQL Ping",
        "description": "Total time: 2.0E-5",
        "value": 2.0e-5,
        "status": "ok"
    }, {
        "name": "MySQL Fetch Operation",
        "description": "Total time: 0.00017",
        "value": 0.00017,
        "status": "ok"
    }, {
        "name": "Disk space",
        "description": "/dev/sda1 33%",
        "value": 33,
        "status": "ok"
    }
  ],
  "status": "ok"
}
Second step: Create a monitor for the server in Semonto.
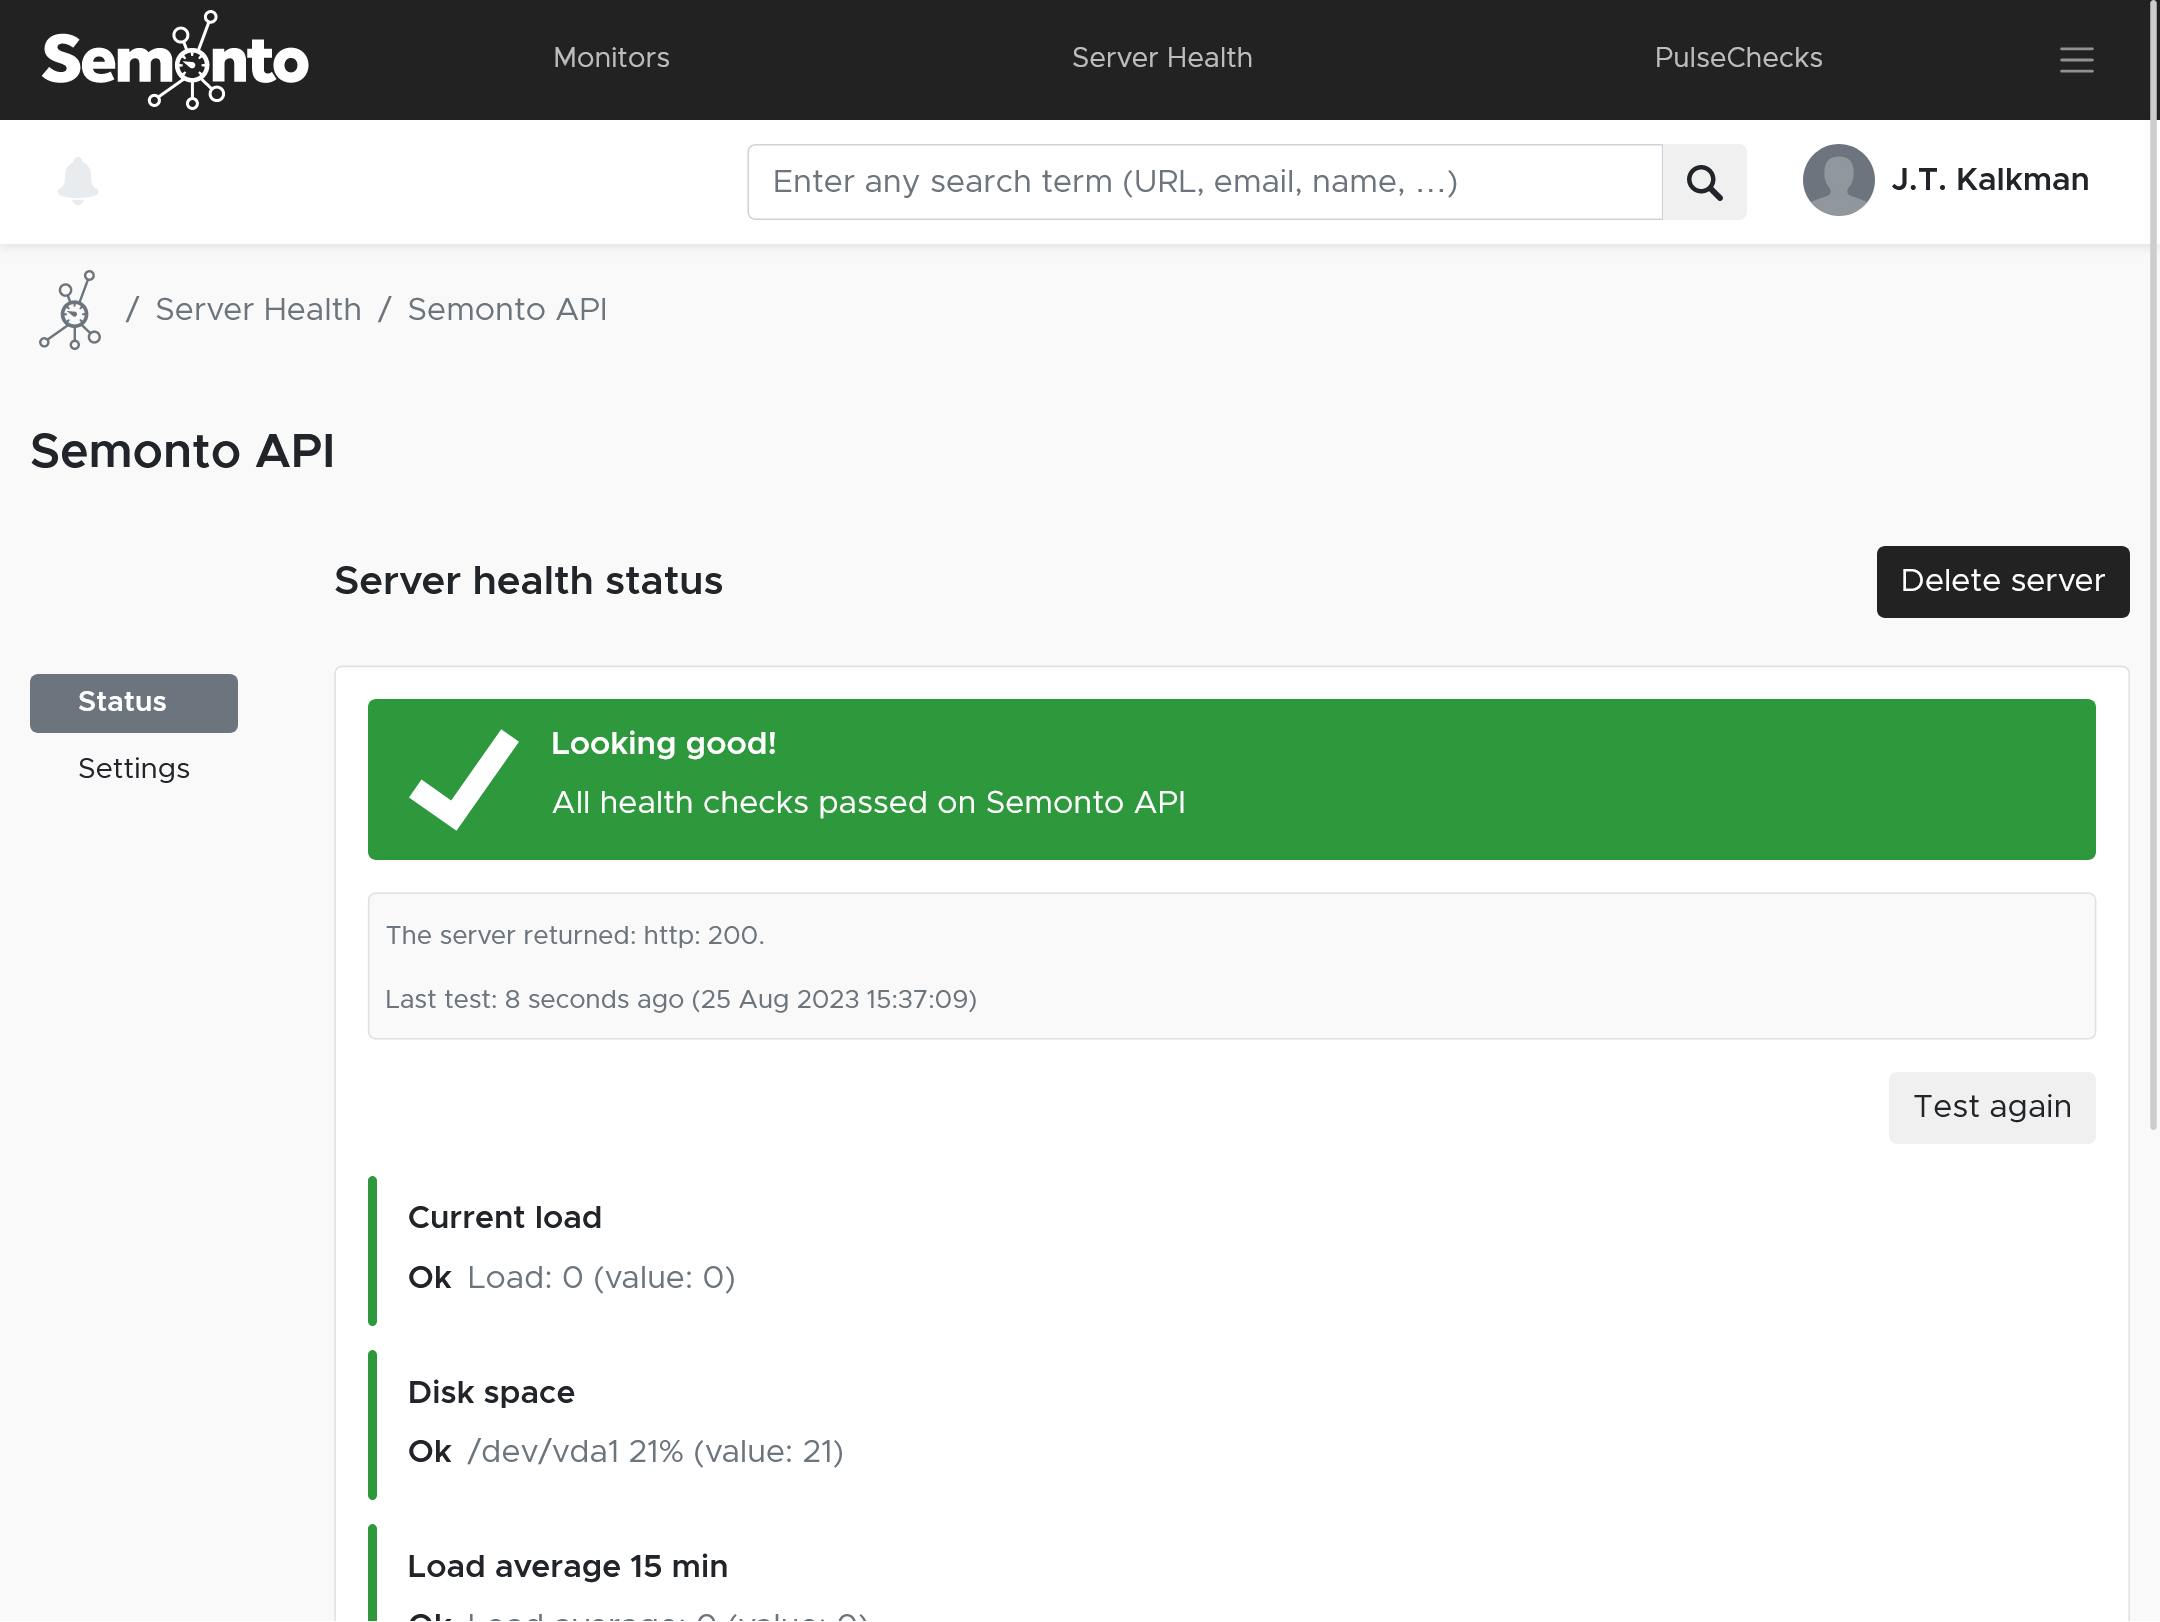
Now that you have created a health endpoint, you can connect it to Semonto. We will then periodically query the health endpoint and notify you of any issues. The Semonto dashboard will show the current status, and the status of the subtests, if present.
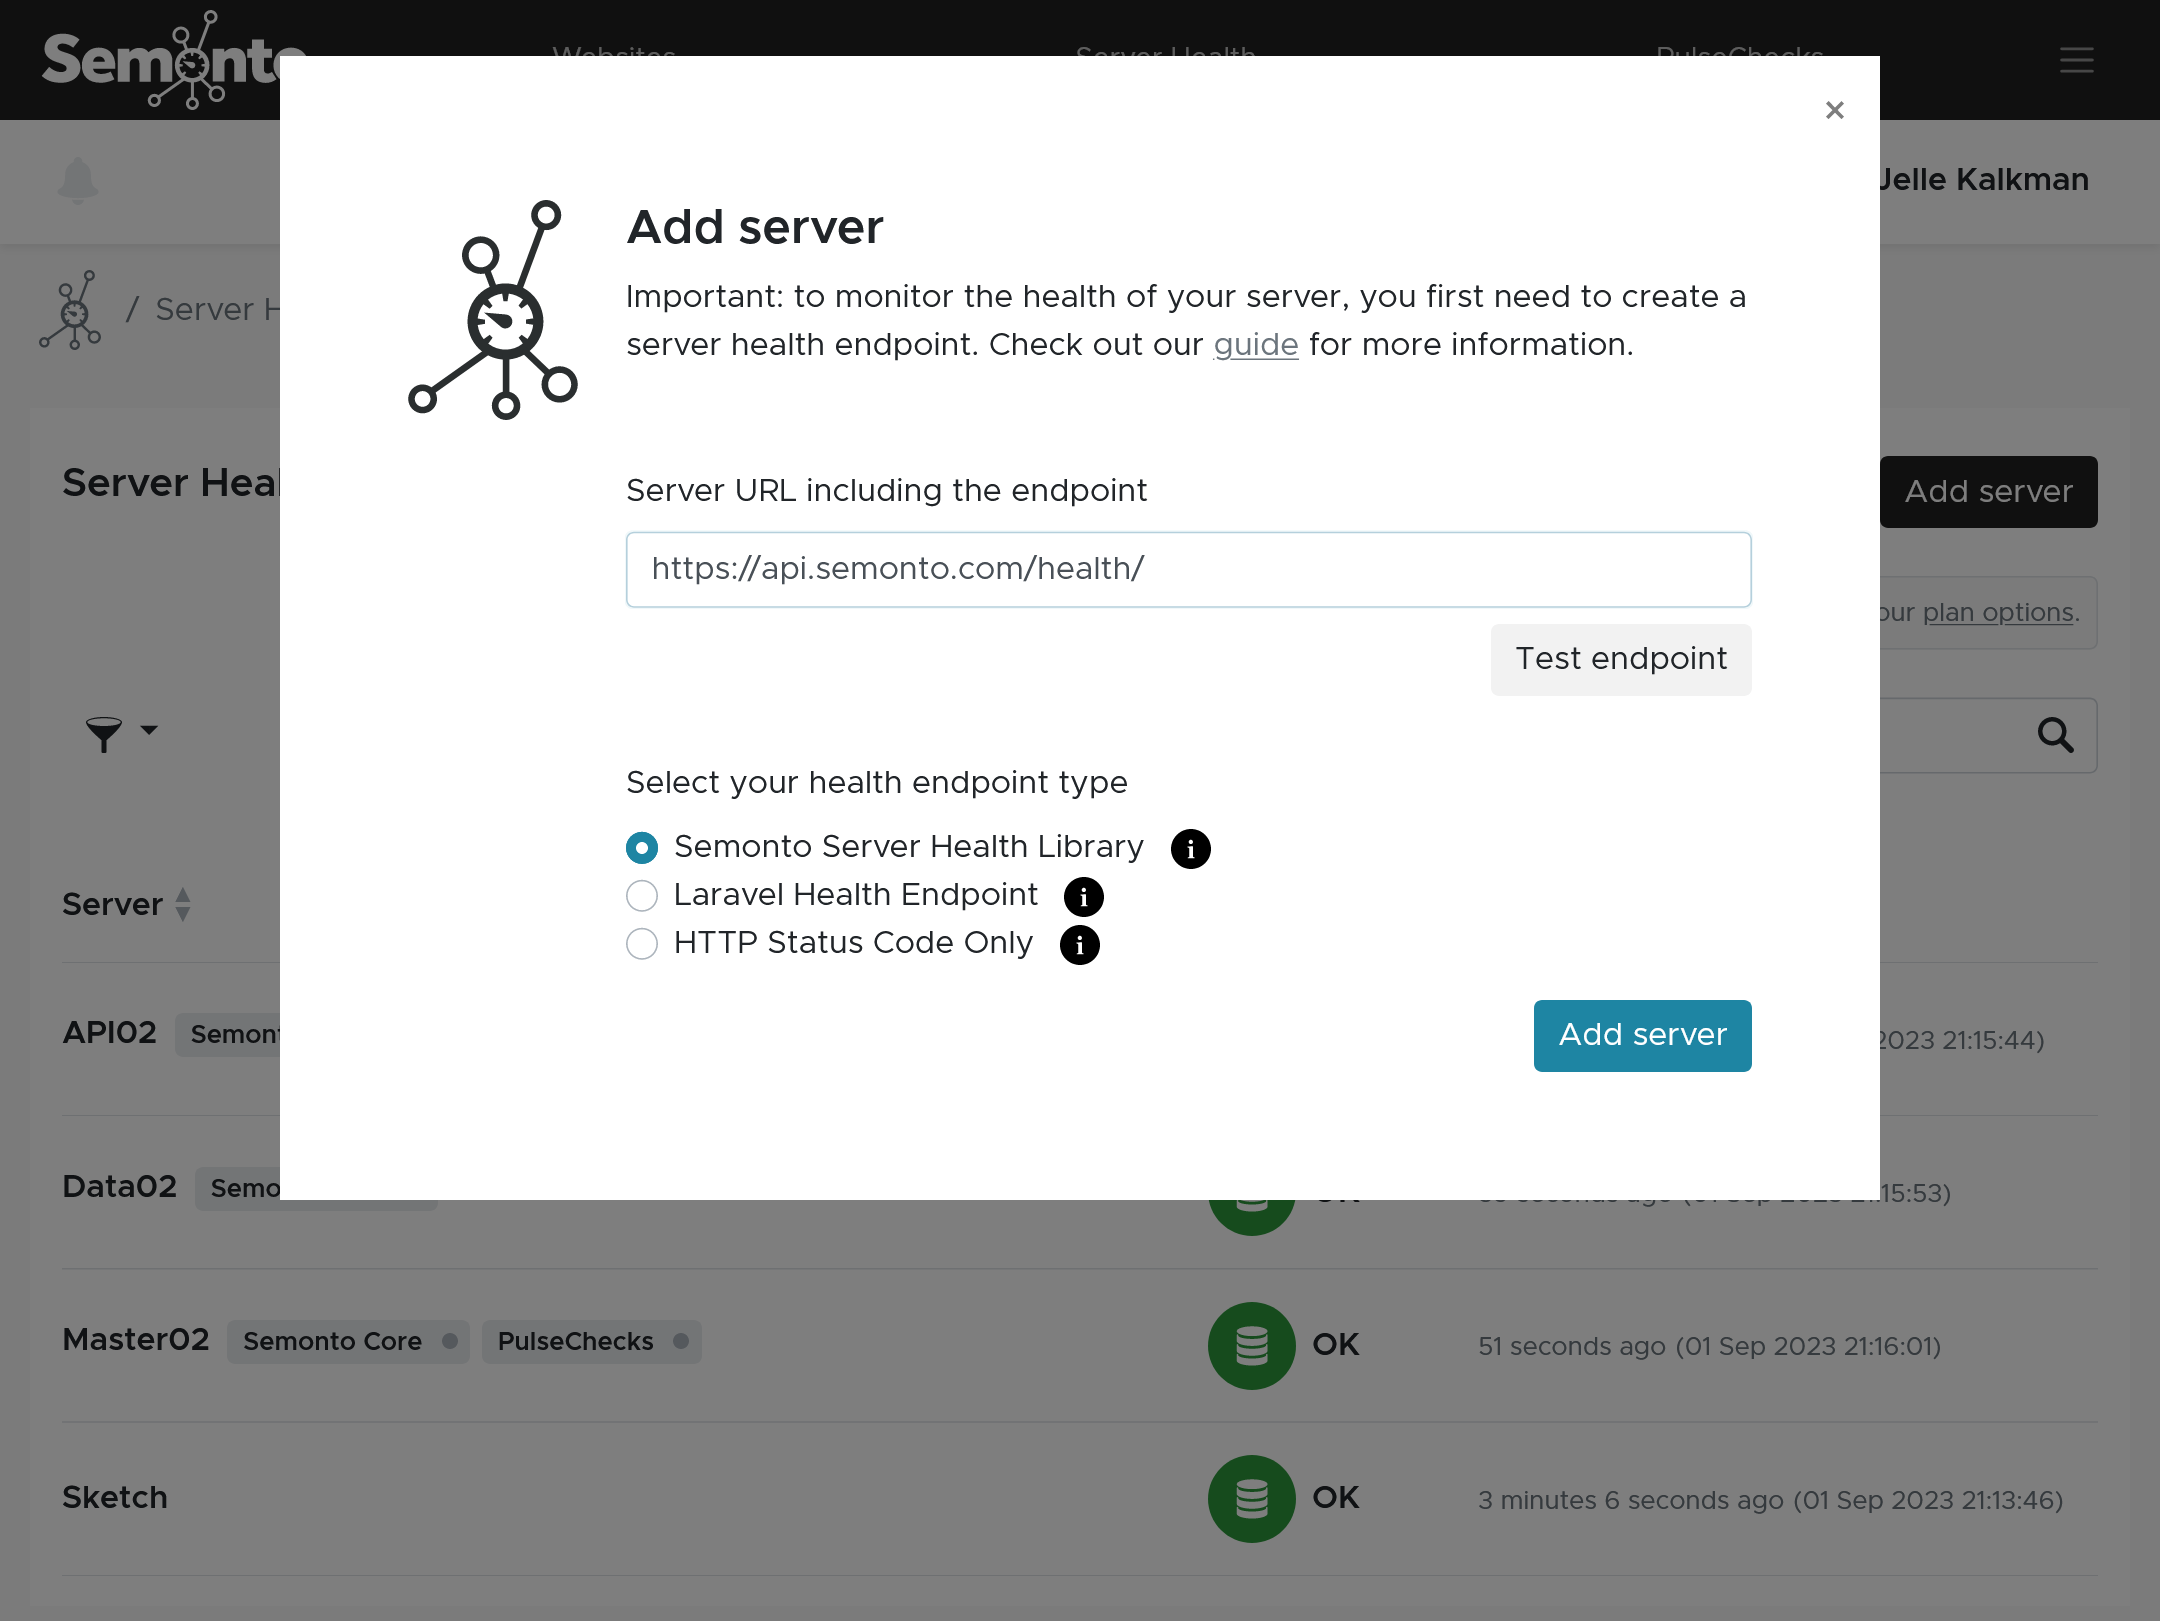
- Go to Semonto Server Health in the main menu.
- Select “Add server”
- Enter the endpoint URL e.g.
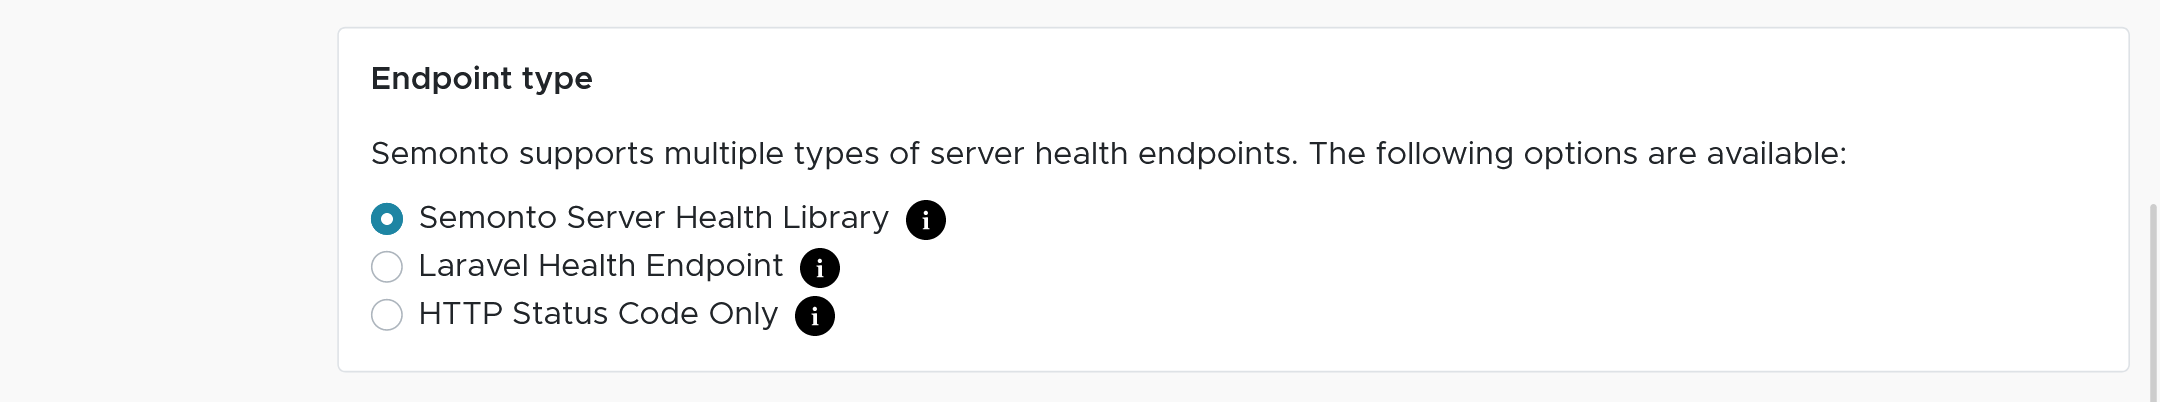
https://myserver/health - Select the type of server health endpoint: Semonto, Laravel Health or HTTP Status Code Only when your format is not supported. Select the framework that corresponds with the software stack you already have on your server and are using for your websites or web applications.
- Semonto: compatible with all PHP servers (subtests possible)
- Laravel Health: compatible with Laravel (subtests possible)
- HTTP Status Code Only: any other framework (subtests not possible)
- Use the test button to verify that everything is up and running on your side. Semonto will then test if all our test locations can reach the server and get the JSON data.
- Hit “Add server” to create the monitor, if all turns out OK
- Enter the endpoint URL e.g.
- Wait for Semonto to start monitoring the server. This will take max 5 minutes.
Extra configuration options:
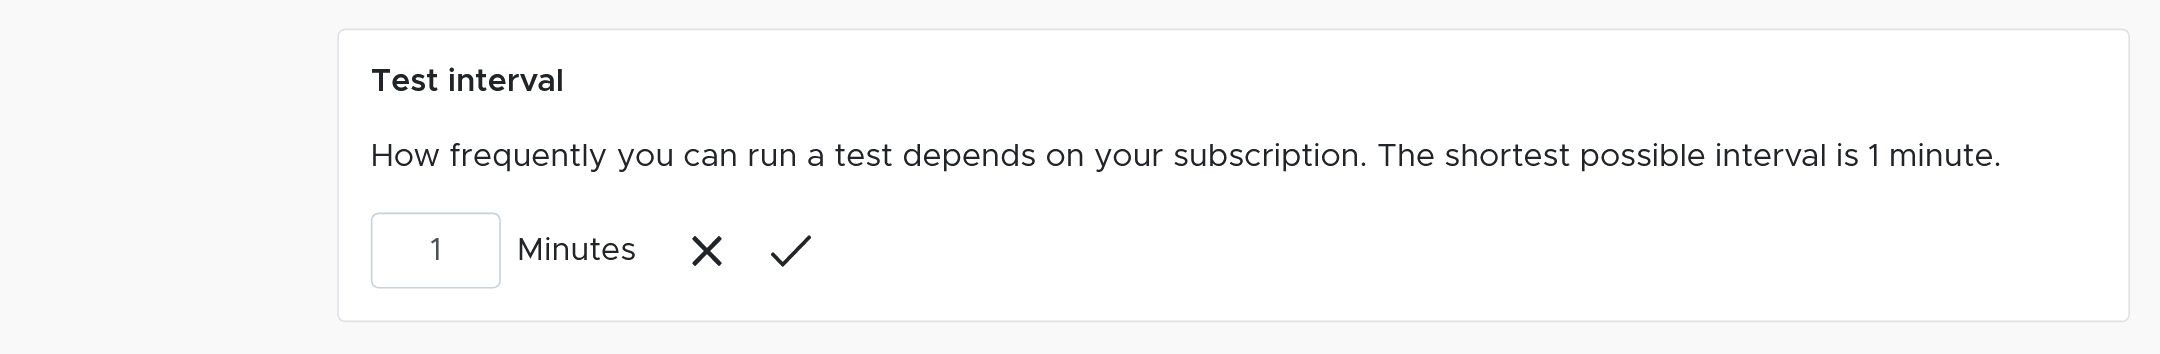
- Change the interval. The default is set to 5 minutes.
- Change the test location. We recommend picking the location nearest to you.

- Change the type of endpoint. Always select the framework that is compatible with the software stack that you have on your server and are using for your website or web application.
- Configure the alerting options for server health if needed. Check out our docs about our notification options.
Securing your health endpoint
If you want, you can add additional security to your health endpoint.
There are multiple ways to do that:
- Via IP addresses: You can restrict which IP addresses can load your health endpoint, for example, by using the .htaccess file. In this case, we have a list of the IP addresses used by Semonto. Make sure to grant access to all our IP addresses for a good working of Semonto. This is our list of IP addresses in multiple formats:
- Via GET Parameter: If supported by your framework, you can add a GET parameter in Semonto and configure your framework so that any status information is only returned when the correct GET parameter with a fixed token is set. If the incorrect token is used or the token is missed, the framework should return an HTTP 403 error.
- Via User-Agent: All requests by Semonto are using the following UserAgent
Mozilla/5.0 (compatible; Semonto/2.0; +https://semonto.com/monitoring; websiteMonitoring). If your framework supports limiting by a user agent, you can add and whitelist our user agent to shield the status results. This method is less secure but should offer an acceptable base protection. - Via a custom HTTP header: Semonto adds a secret key in a custom header to the request to your server. Semonto generates a new secret key for each monitor. You can use this key to check if the request is from Semonto on your server. The default header for this secret key is
health-monitor-access-keyhowever you can change this to be compatible with the framework you use. Don’t change this header if you use our framework.
Monitoring a WordPress server with our WP plugin
If you are using WordPress, you can also install our Semonto WP plugin for your server monitoring. You create the server health endpoint in Semonto enter it in the plugin settings on WordPress. There, you can further define the tests you want to run. The results will appear directly in your WordPress dashboard. More about WordPress monitoring with Semonto