Get the most out of an uptime report
In this guide, we explain what information you can retrieve from the uptime reports in the Semonto dashboard and how to interpret the results.
Contents
What is an uptime report?
An uptime report shows the percentage of time your website, webshop or server has been working and available. It also lists the number of times problems occurred and how long these issues lasted. An uptime report is an objective tool to measure the availability of your service.
How to access the uptime reports in Semonto
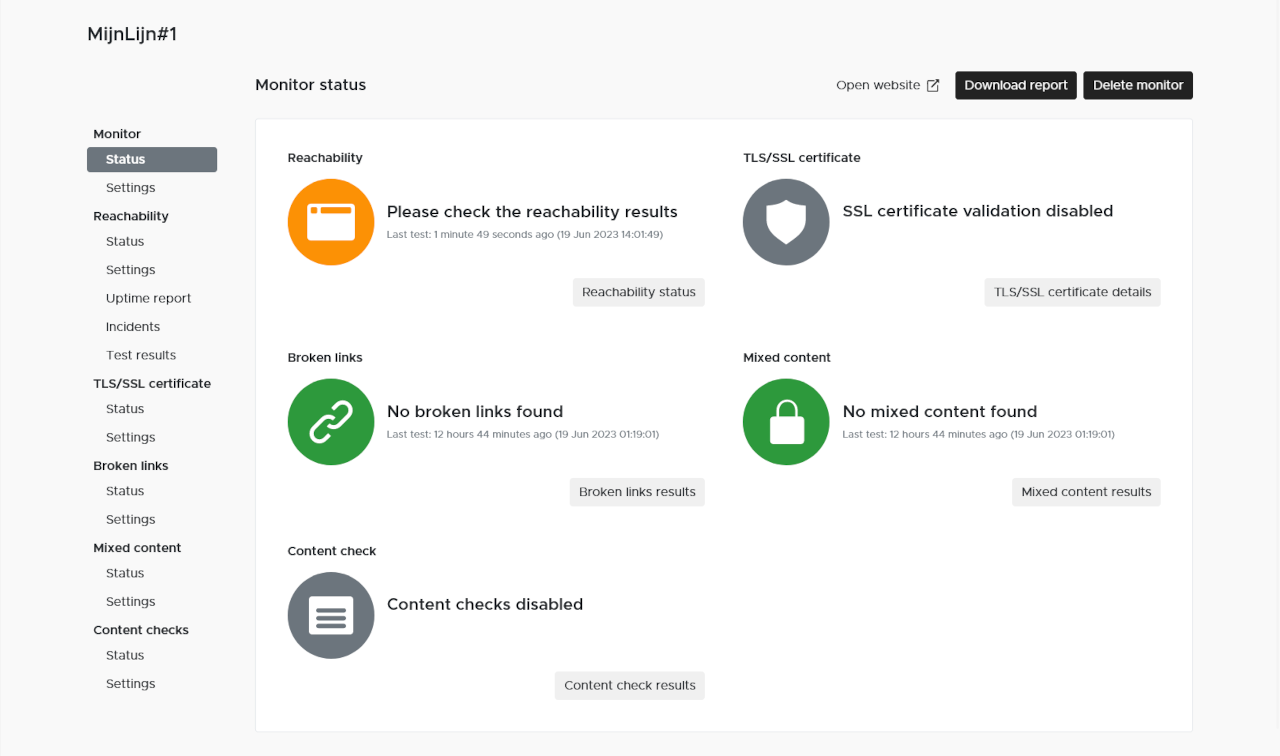
Sign into the Semonto dashboard. and select Reachability in the left menu. Click on the URL of your choice and then select ‘Uptime report’.
How to read an uptime report
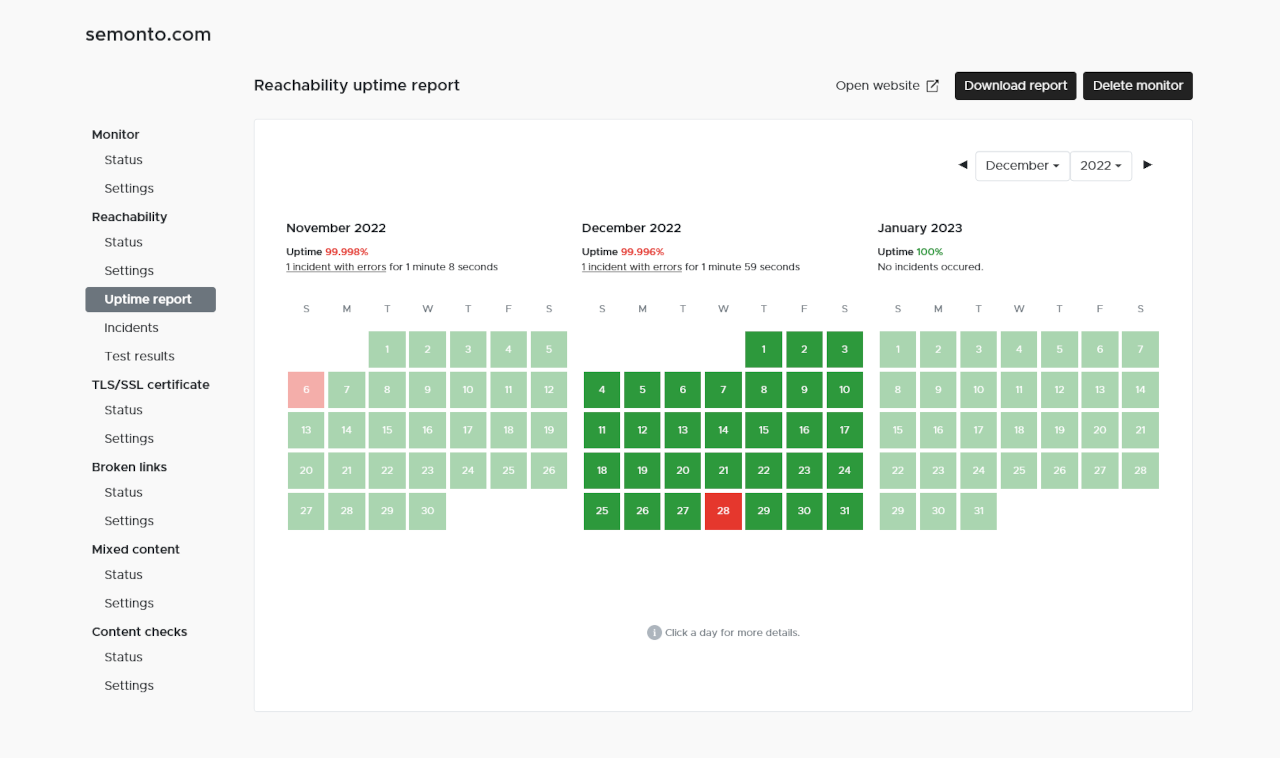
The uptime report reads like a calendar. For each day, you can see whether Semonto found issues with your monitor. Days with errors appear in red, days with warnings are orange and days without problems are green.
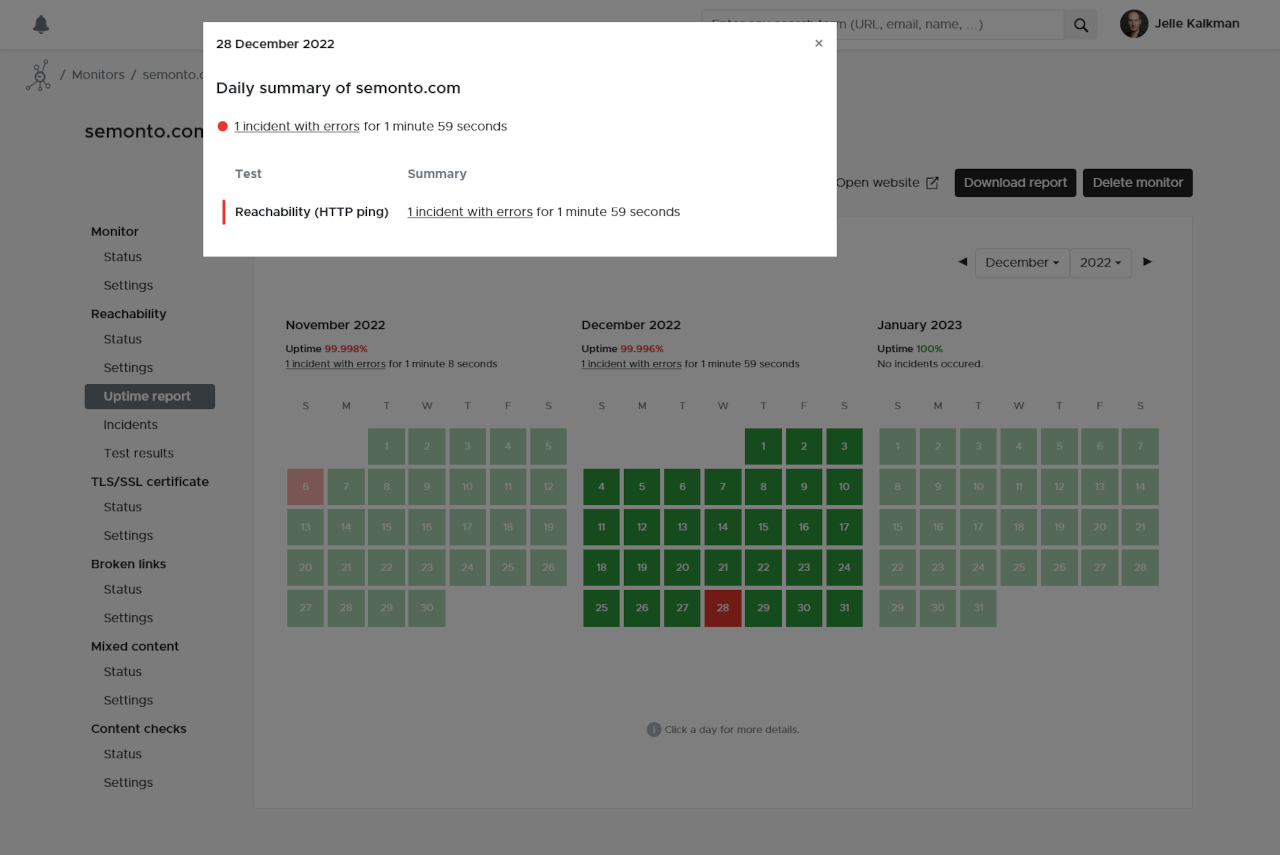
If you want to inspect what has happened on a specific day, you can also click on that day in the calendar. Semonto will show you which tests have failed, triggered a warning and succeeded. From there, you can select the results of a specific test for further investigation or go to the incident report to see all the incidents.
In the Reachability menu, below the Uptime Report, you can also go directly to the incidents.
If you want to inspect what has happened on a specific day, you can also click on that day in the calendar. Semonto will show you which tests have failed, triggered a warning and succeeded. From there, you can select the results of a specific test for further investigation.
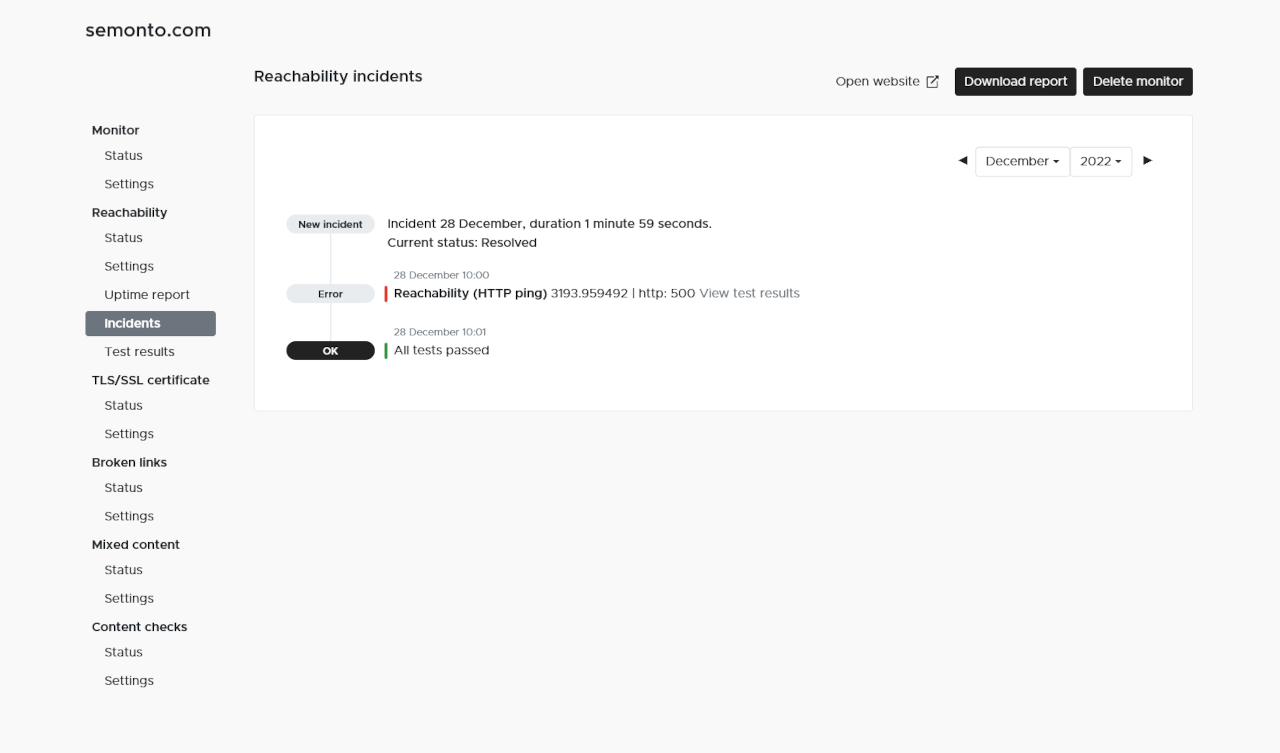
Incidents
In the Incident section, you will find a more detailed log of the events that happened in the selected month. The incident list mentions which test(s) have failed and the exact timestamp and duration of the issue.
Inspecting the test results
In the reachability menu, you also have a section called Test Results. Within the results of a specific test, you can select a year, month, day or hour for further analysis of the performance. If you select a year, you find the results for each month in that year. When you choose a month, you will find the results for each day within that month. For a day, the results will show every hour on that day. When you select the hour view, you can inspect more precisely when a test has failed.
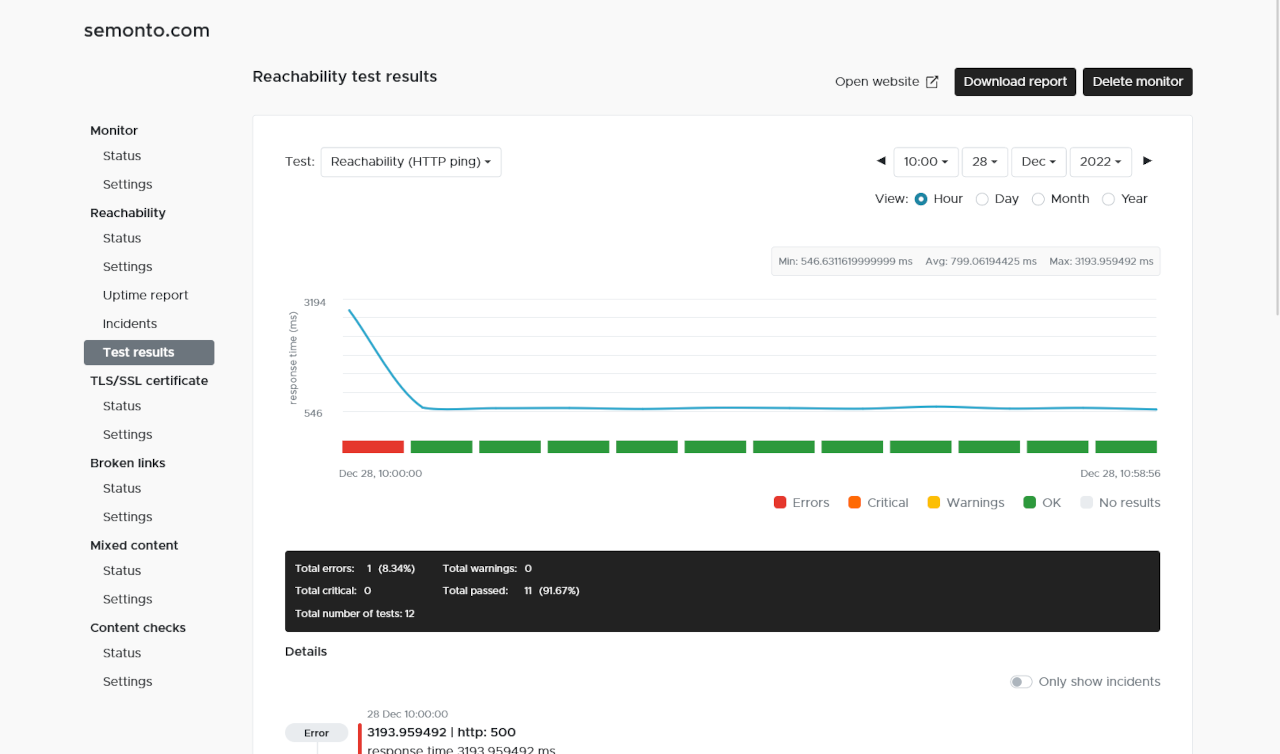
Within this view, you also have the option to enter the log with the 'Show Log' button if any issues occurred. And you can easily select another test within the same timeframe with the selector directly above the chart to the left. When you hover above the chart, a tooltip shows the results, allowing a quick overview. For a more thorough inspection, you can use the tables below the graphs.
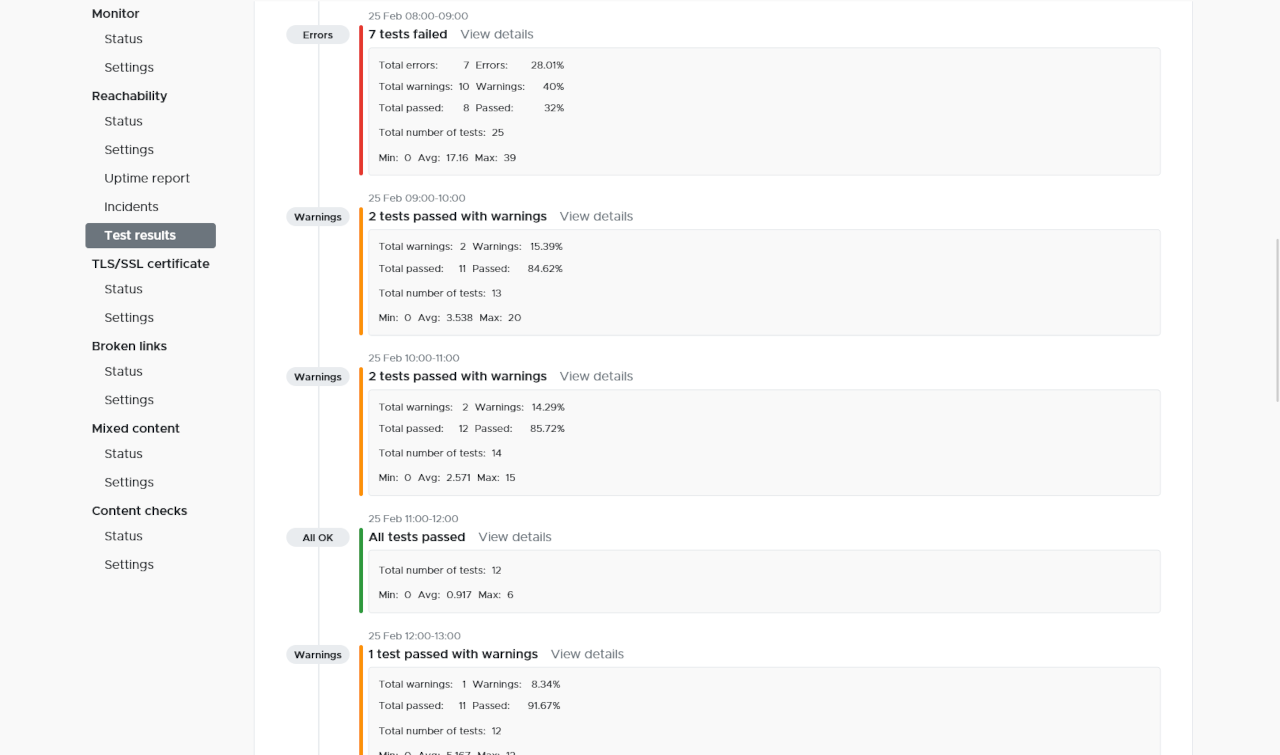
For example, you can see that between 10:00 and 11:00, a test failed. You can navigate to the specific hour with the link at the righthand side of the table.
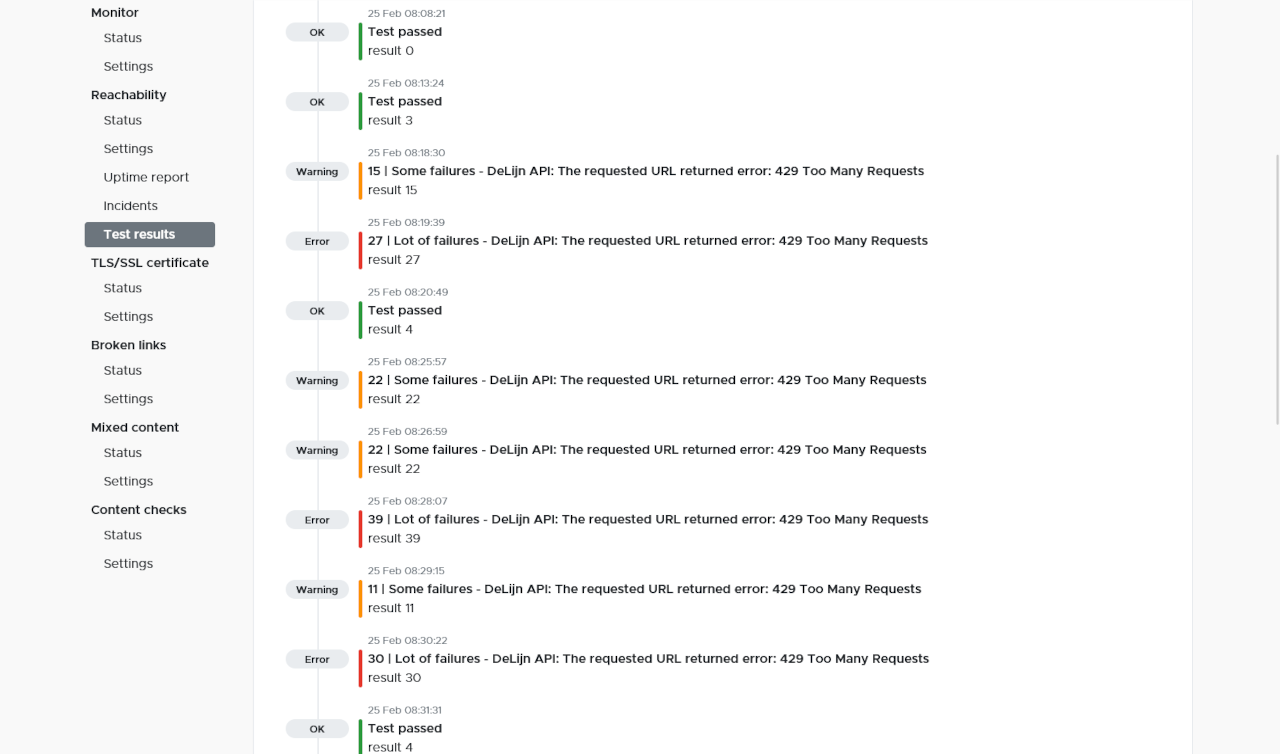
Now you know how to find the exact moments when your website or server has failed. In this example, we have used results from our custom tests. You can use our guide on the most common errors to better understand what has gone wrong so you can prevent these issues from happening again and improve the uptime of your monitor.
Download the report as a PDF
At the top of the page, you will find a button to download a complete performance report as a PDF. This report contains an overview of the health and performance of the website for a selected period. This will include the reachability results, an overview of the uptime, broken links, mixed content and more.
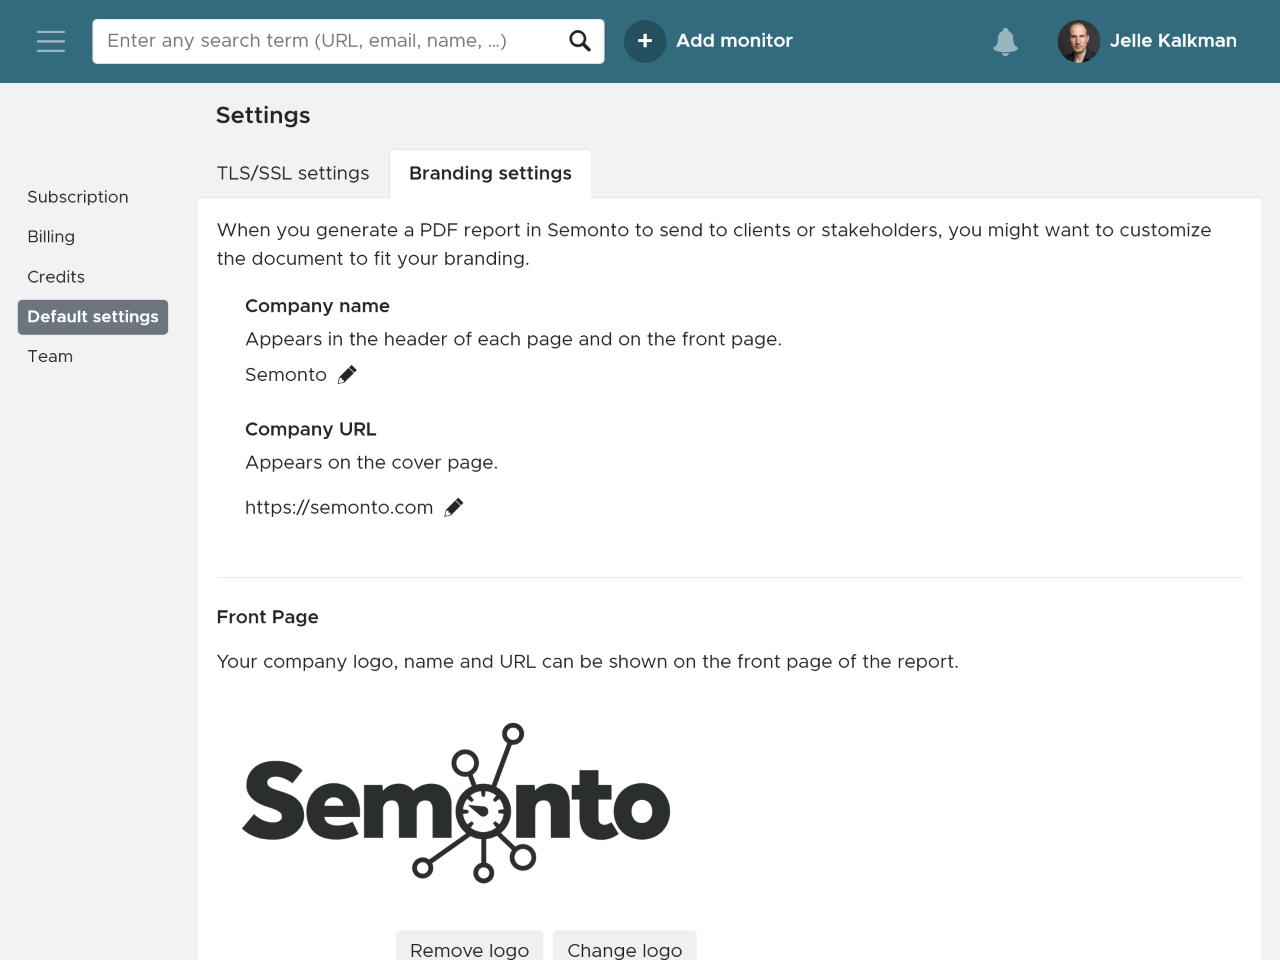
Add your company branding
You can add your company branding to the PDF report. To do this, go to Settings and select Branding settings. There, you can also upload your logo, favicon, company URL, and company name to this page. If you want, you can also make the header of every page of the report clickable. The header will then link to your homepage.
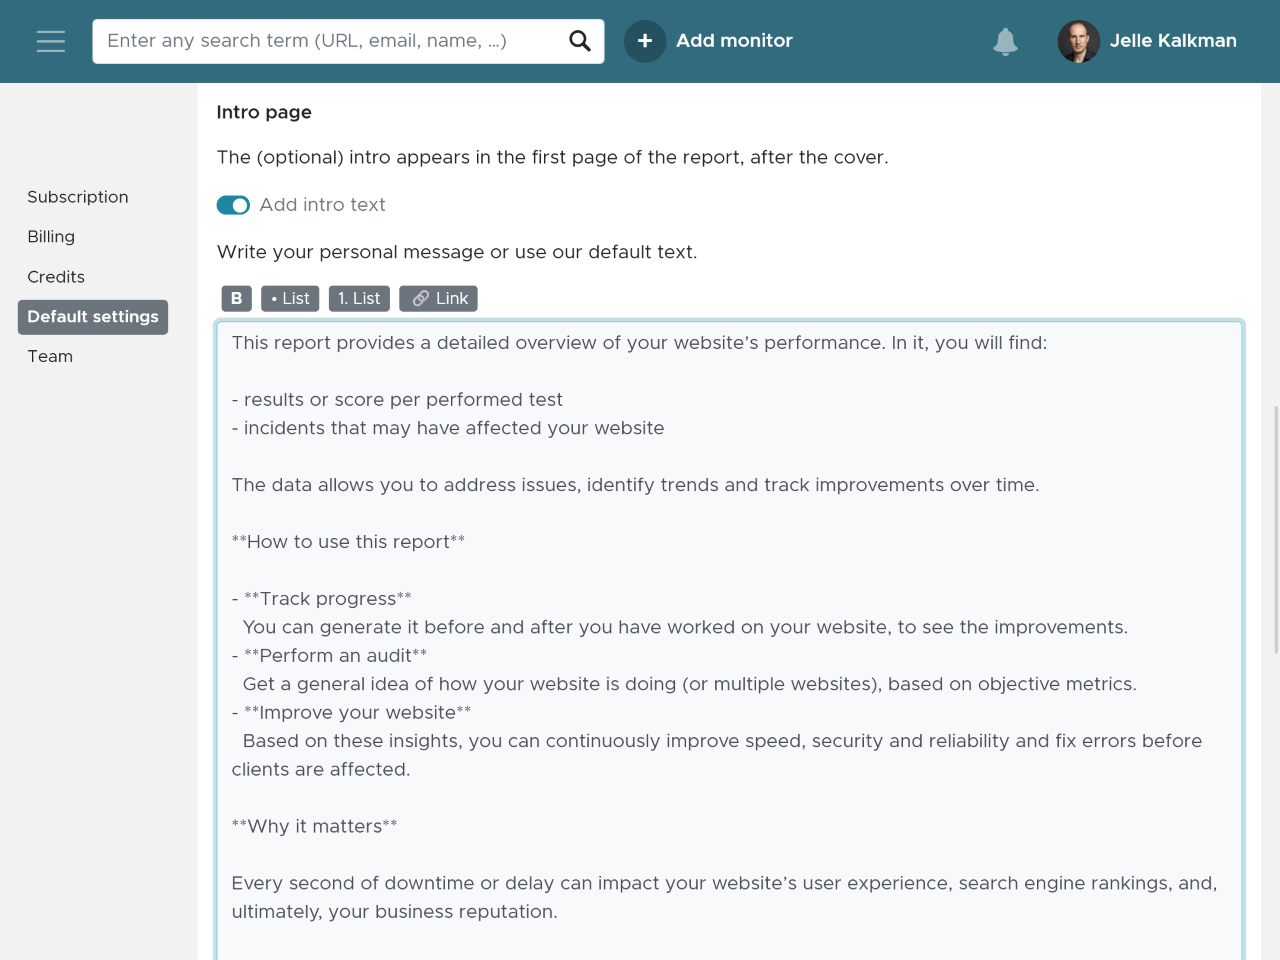
Write your own preface
We have also added a text field where you can write your personal introduction text for the report. The intro will be added to the document after the cover page. It allows you to make the report more catered to the receiver, adding more context or explanation if needed.
Related guides

QuickStart Beginner’s Guide to Semonto

How to Check Your Website for Broken Links With Semonto

How to Check Your Website for Mixed Content

How to monitor your TLS/SSL certificates

How to monitor server health with Semonto