
Why we added JSON exports
Our users asked for a way to work with Semonto uptime results outside the standard PDF performance report.
- Agencies wanted to feed the data into dashboards.
- Developers wanted to keep their own archives.
- Compliance teams needed machine-readable evidence for audits.
The new JSON export meets all those needs with a single download that contains all the uptime data you see in Semonto, ready to use anywhere.
How it works
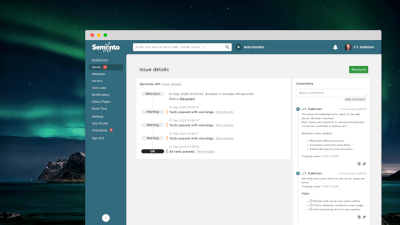
- Open your Website overview or Server overview, select the monitors you want to include, and click Download.
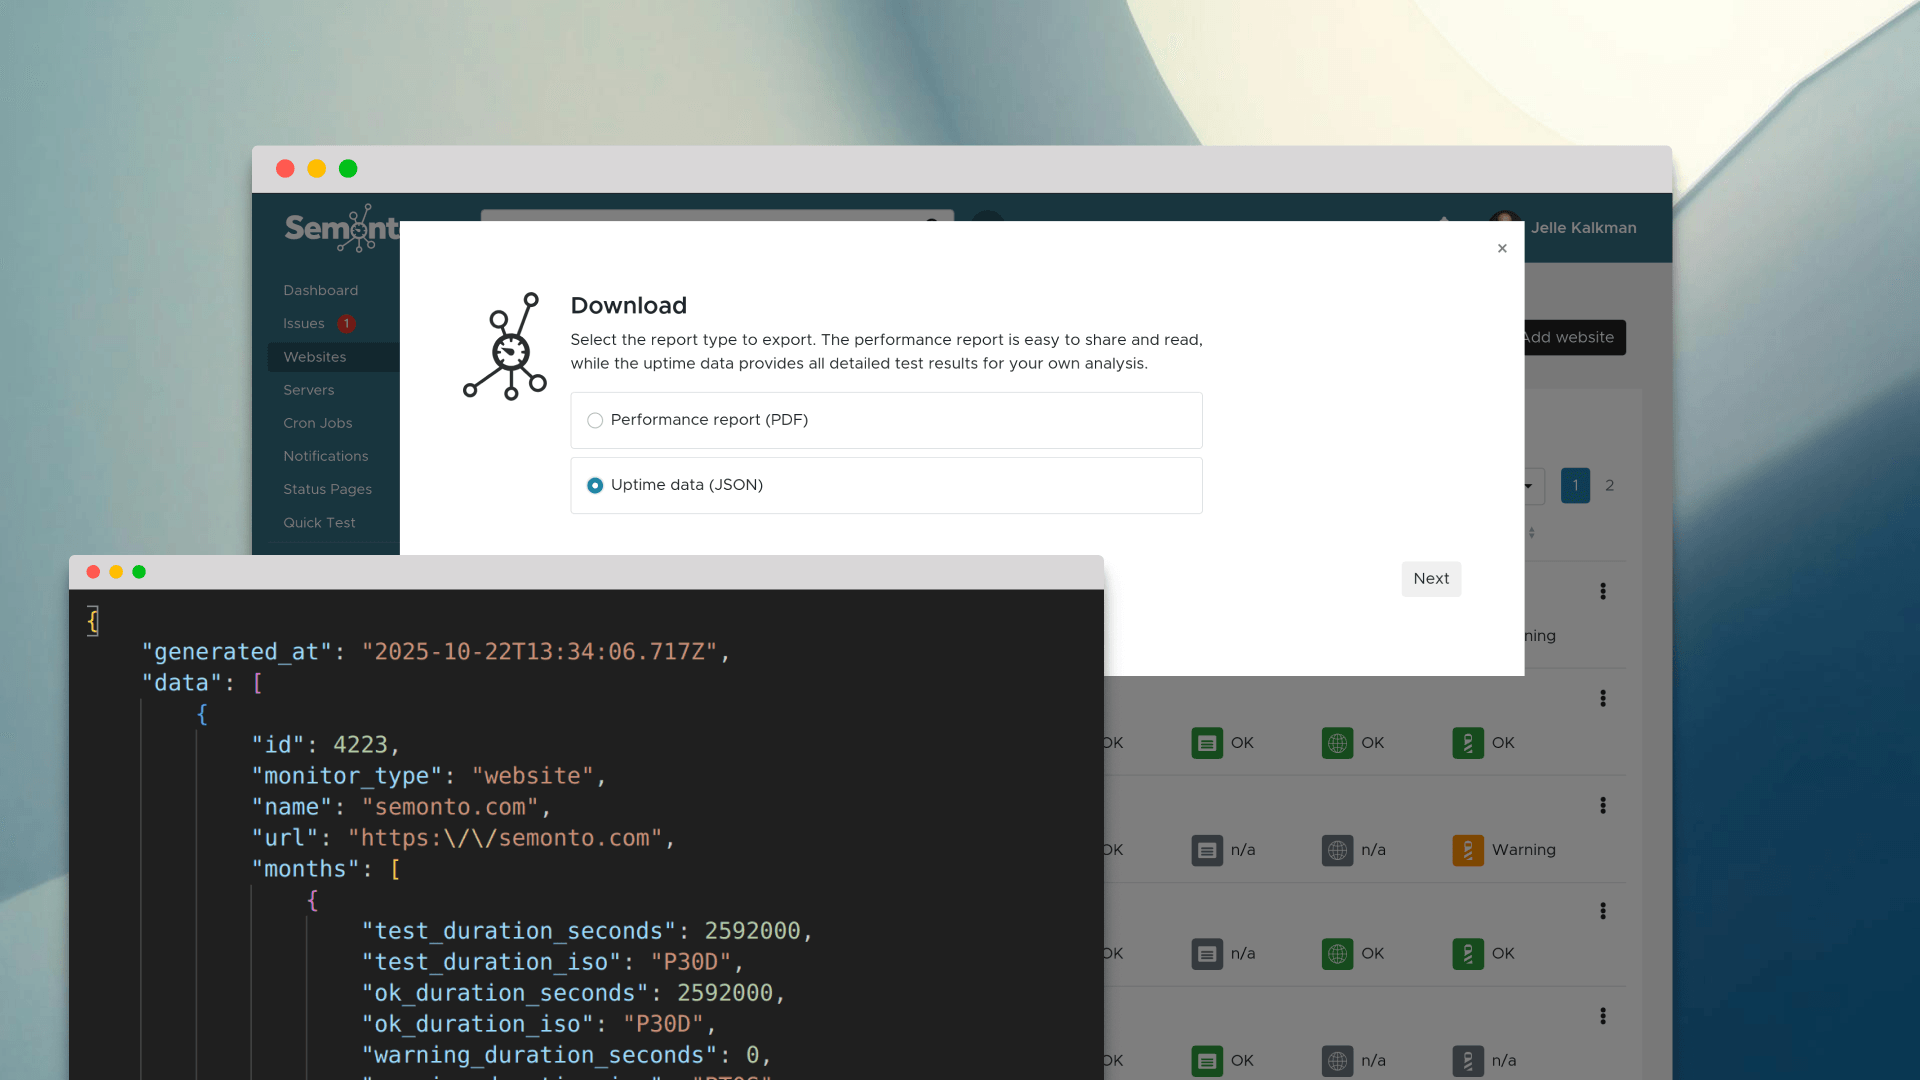
- Select Uptime data (JSON).
- Pick the time period and confirm.
Semonto will generate the export file, save it to your device, and email you a download link so you can retrieve it again later.
What’s inside the file
The JSON export contains the same uptime data you see in Semonto, just without the formatting. For each monitor, you’ll find:
- Monthly summaries and daily breakdowns
- Per-test statistics about uptime and incidents
- Durations in both seconds and ISO 8601 periods
This makes it easy to plug the data straight into spreadsheets, BI tools, or custom scripts.
Benefits for your team
- Build automated reports by mixing Semonto data with metrics from other systems.
- Share incident evidence with clients, stakeholders, or auditors who need verifiable uptime logs.
- Keep an independent archive of uptime history for long-term benchmarking.
- Integrate directly into your own dashboards or alerting pipelines. No manual exports required.
Learn more
Need a step-by-step walkthrough? Check out our guide How to download uptime data for screenshots and details about the file structure.
We’re excited to see what you build with the JSON export! If you have feedback or ideas for additional formats, let us know through support. All your ideas are welcome.
Latest blogs
Tips and Tricks
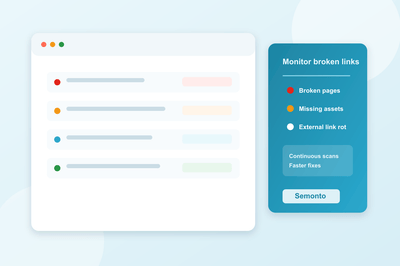
How to Monitor Broken Links: 12 SEO Best Practices (2026)
Tips and Tricks
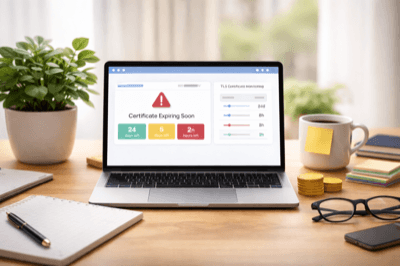
Monitoring Short-Lived TLS Certificates with Semonto

Tips and Tricks