How to download uptime data
Export the raw uptime history from Semonto to share with your team or plug into custom reports.
Contents
In Semonto, you can download uptime data as a JSON file directly from the Website or Server monitor overview. This allows you to use your monitoring data in your own archives, share it with colleagues, or integrate it into your dashboards and reporting tools.
When should you export uptime data?
Export uptime data when you need the raw monitoring results instead of a polished report. For example:
- Combine Semonto’s uptime data with other metrics in your own custom reports or dashboards.
- Share precise, machine-readable uptime evidence with clients or auditors.
- Archive your uptime history for long-term benchmarking or compliance purposes.
How to download uptime data for a website or server monitor
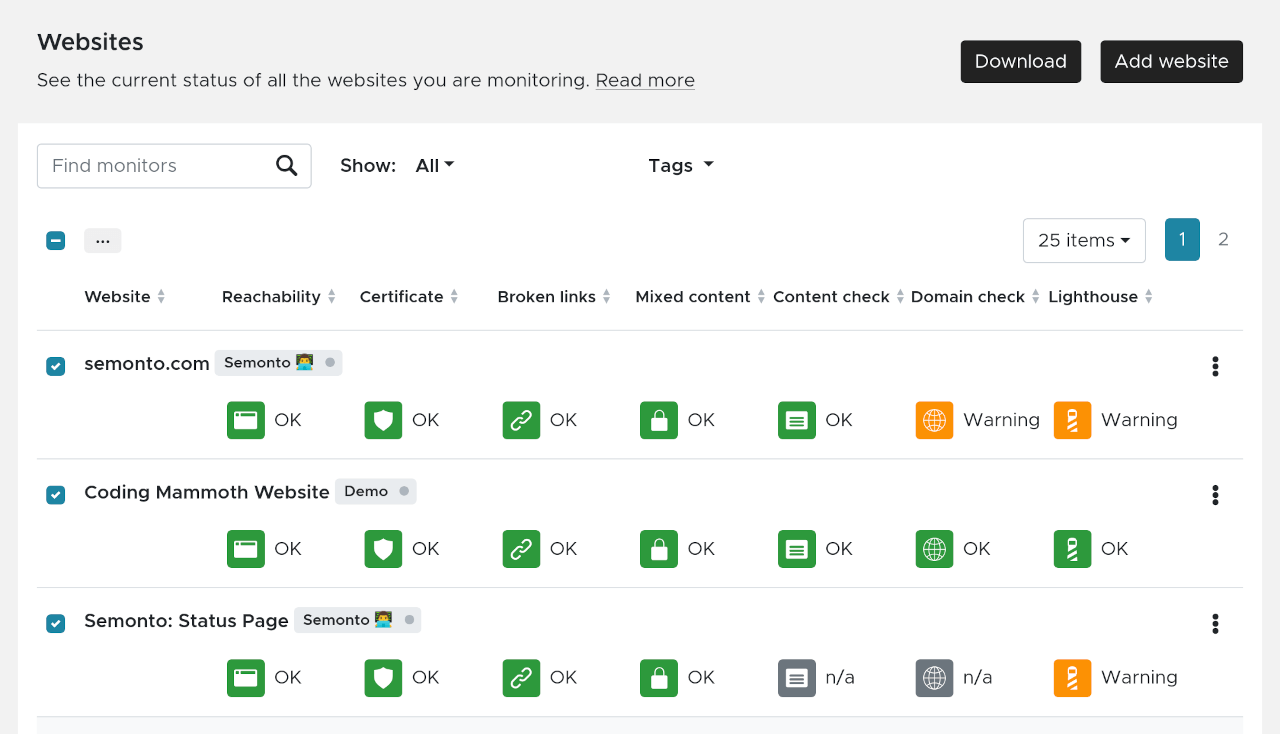
Step 1: Open the Website or Server monitor overview
Log in to Semonto and go to Websites or Servers. These pages list every website or server monitor in your account.

Step 2: Select the monitors to include
Tick the checkboxes next to the monitors you want to export. You can choose a single monitor or combine several in one download.
Step 3: Use the download wizard
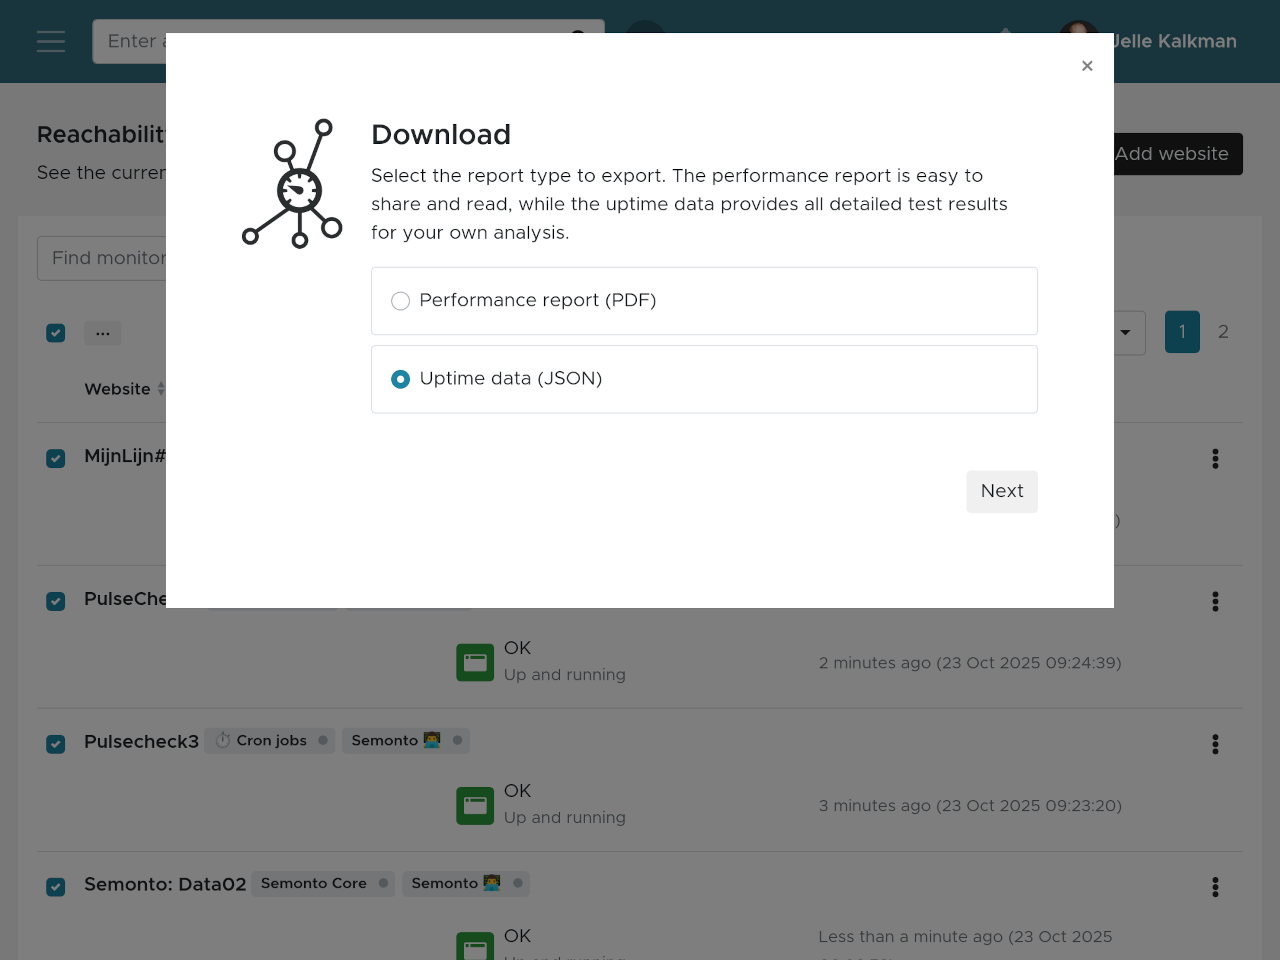
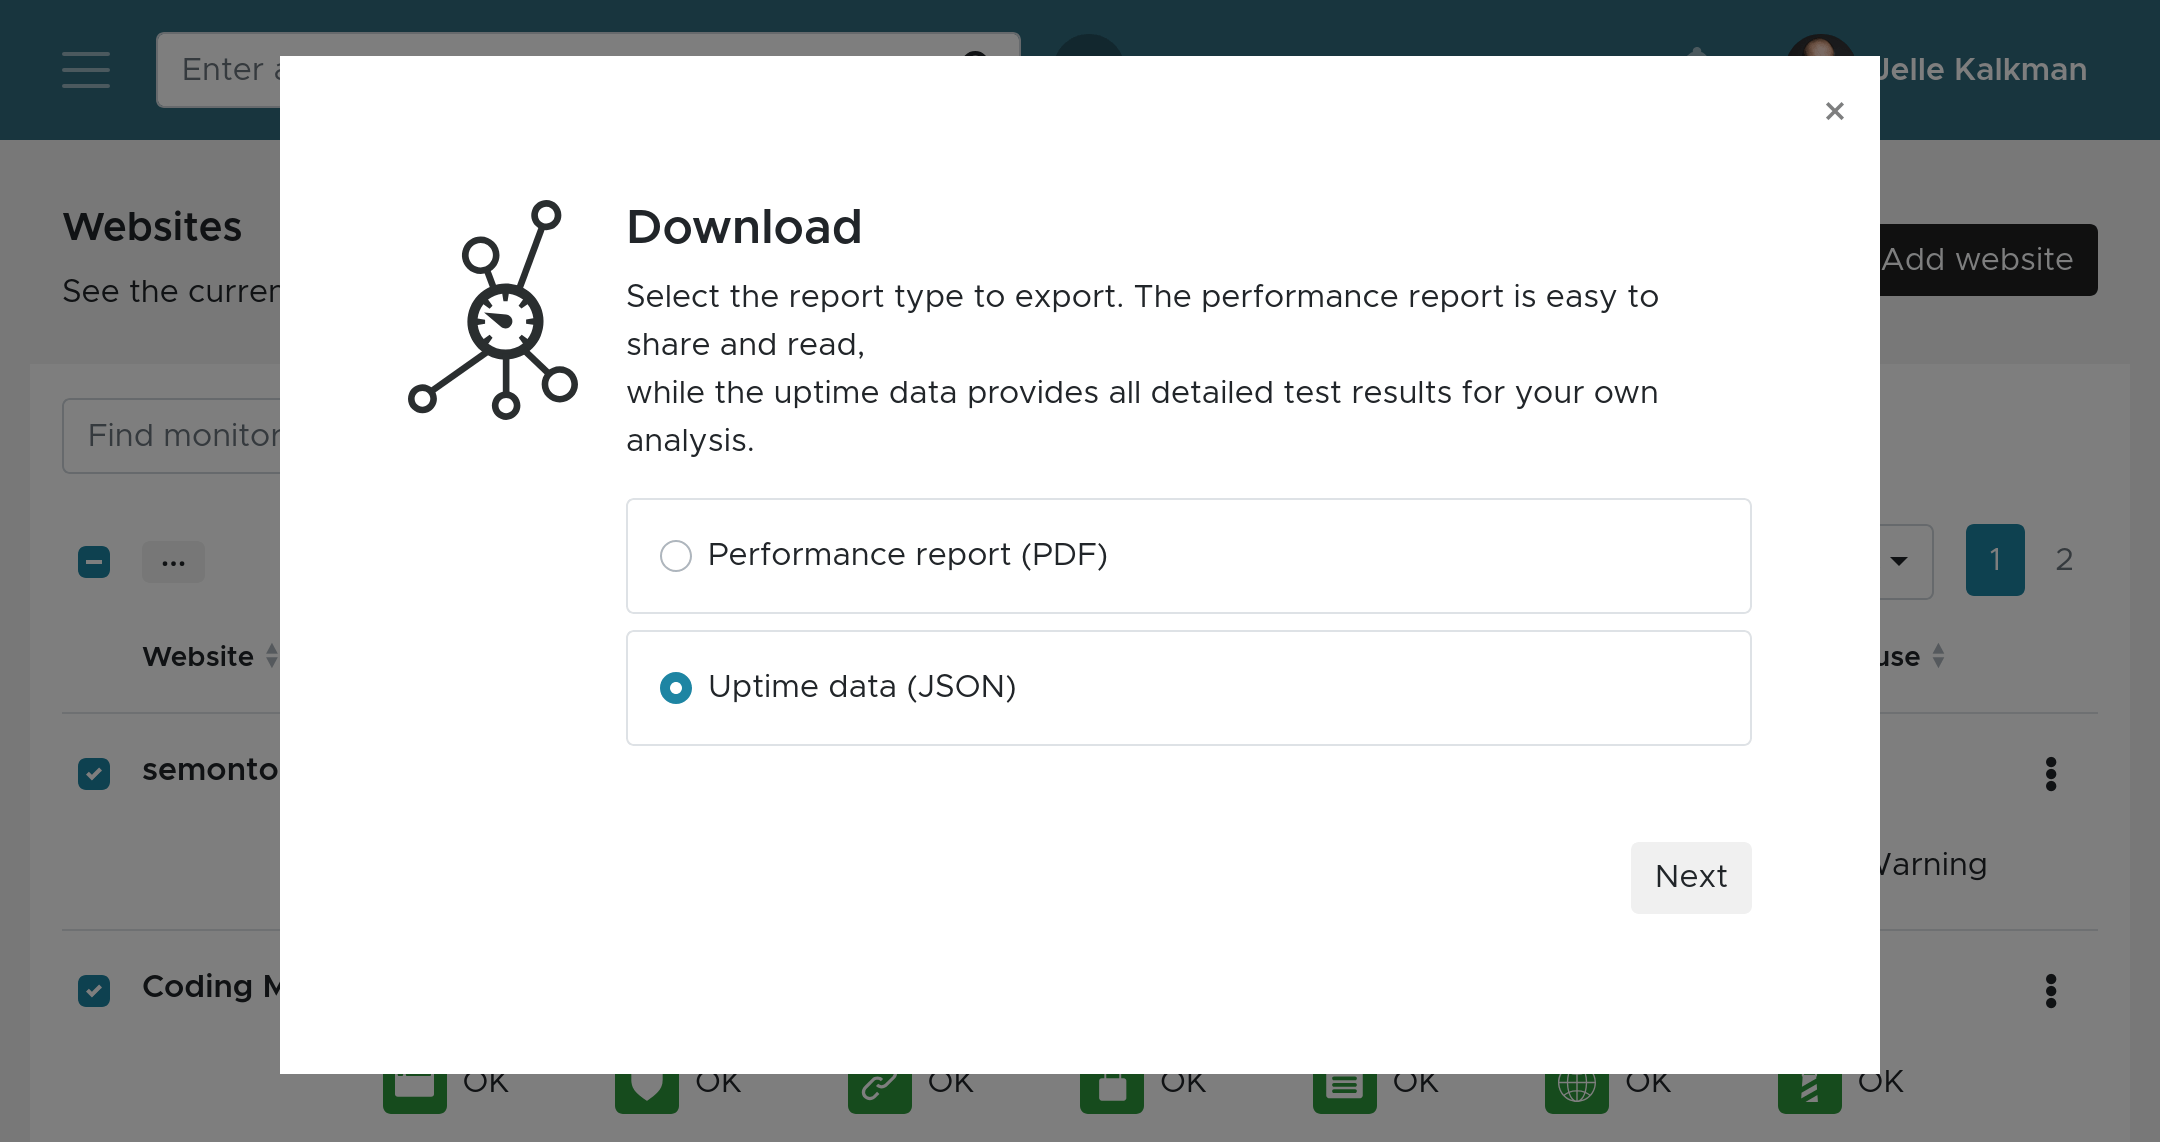
Click Download to open the wizard.
- On the first screen, choose JSON as the format.
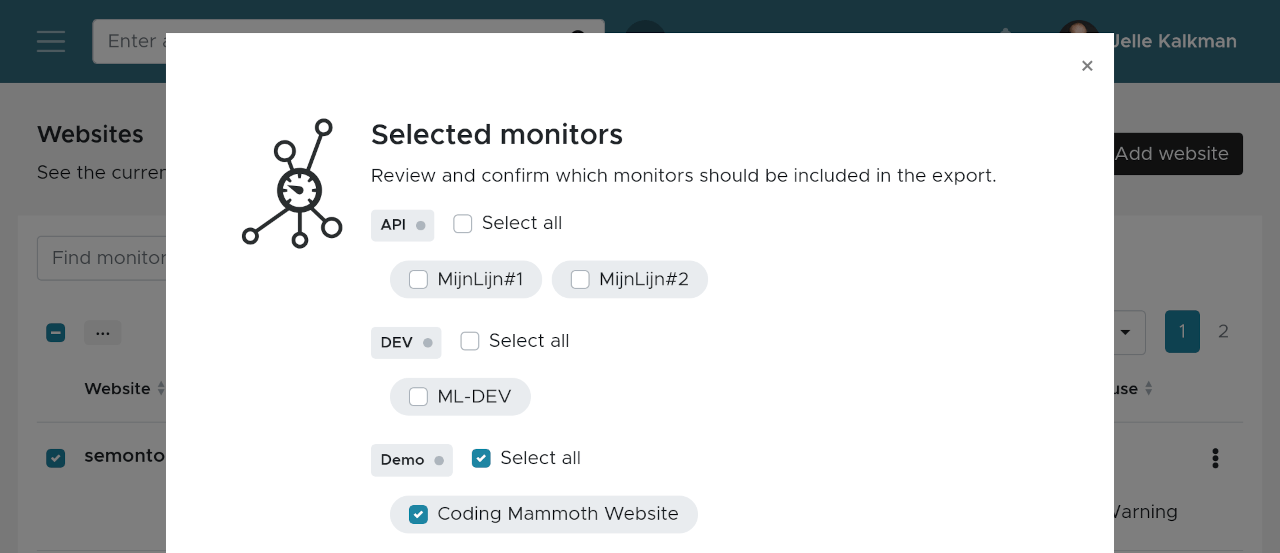
- The second screen shows which monitors are included, and you can adjust the selection if needed.
- On the third screen, set the time period you want to cover, then click Download.
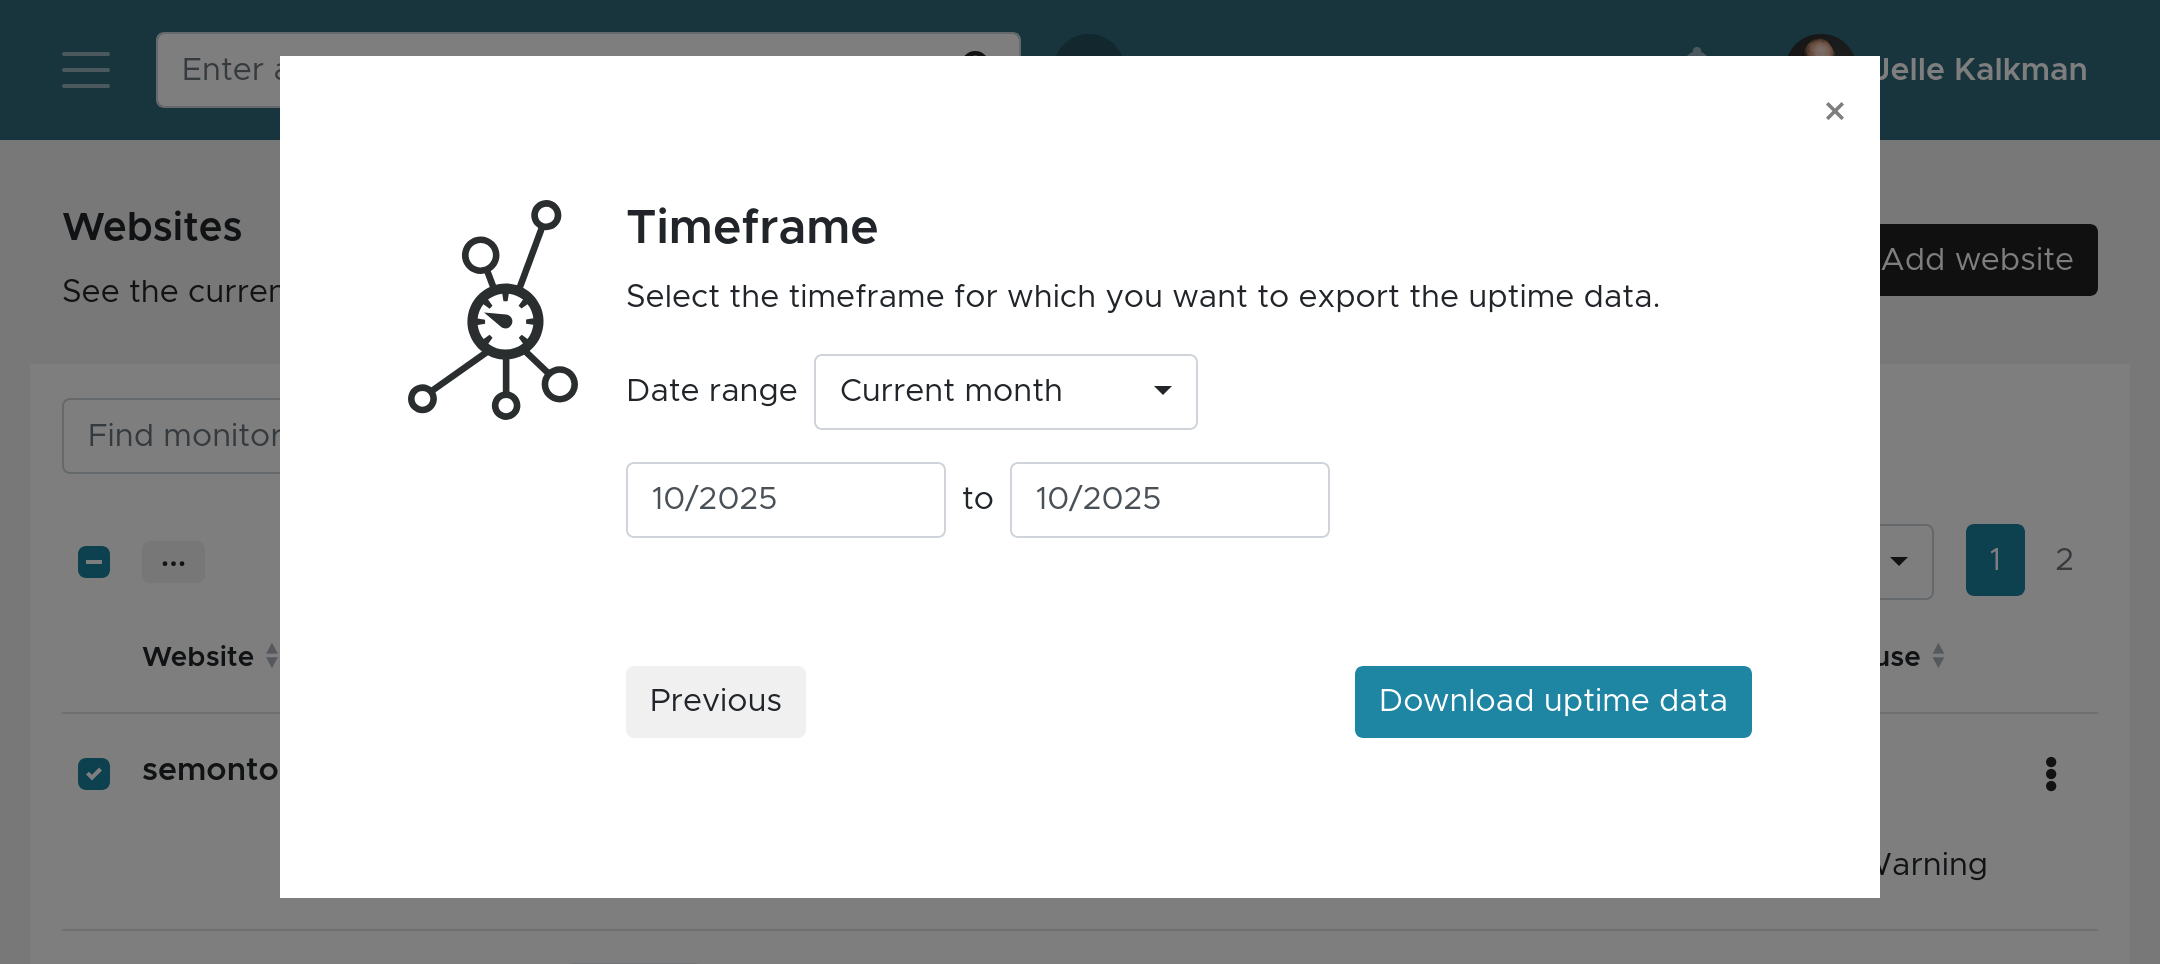
Semonto will generate the file, save it to your device (for example, uptime-2025-09-2025-10.json), and email you a copy of the download link in case you need it later.
The structure of the JSON file
Let’s walk through a JSON export to help you understand how the data is organized.
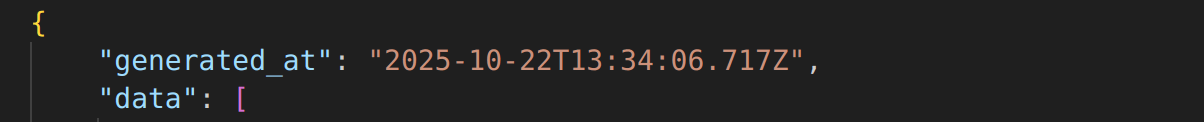
Top-level values
generated_at: The ISO 8601 timestamp indicating when the export was created.data: An array containing all monitors included in the download. Each entry represents one website or server monitor.
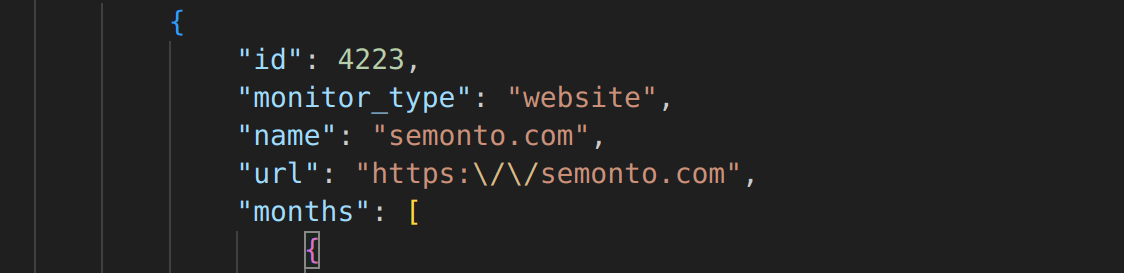
Monitor objects
Each monitor entry includes the following properties:
id: The internal ID of the monitor.monitor_type: The monitor type — either website or server.name: The name of the monitor.url: The URL Semonto checks for this monitor.months: An array that groups the results by calendar month within the selected time frame.
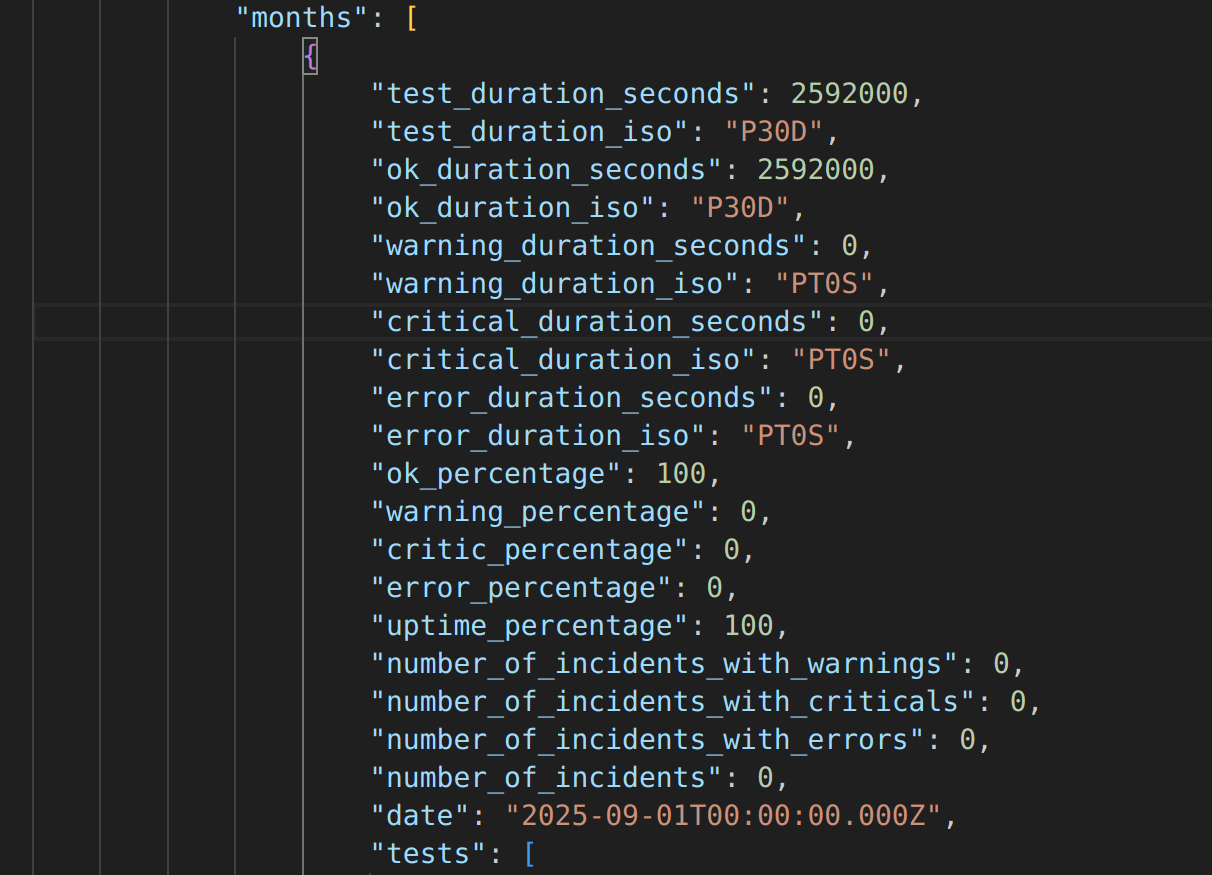
Monthly summaries
Each month object contains the aggregated uptime data for that monitor:
- Duration values appear twice: once as
*_duration_secondsand once as an ISO 8601 period (for example,P29DT7H8M21S). - Percentages (
ok_percentage,warning_percentage,critic_percentage, anderror_percentage) indicate how much of the monitoring period was spent in each status. Theuptime_percentagerepresents the actual uptime. - Incident counts (
number_of_incidentsand the breakdown by severity) show how many issues occurred during that month.
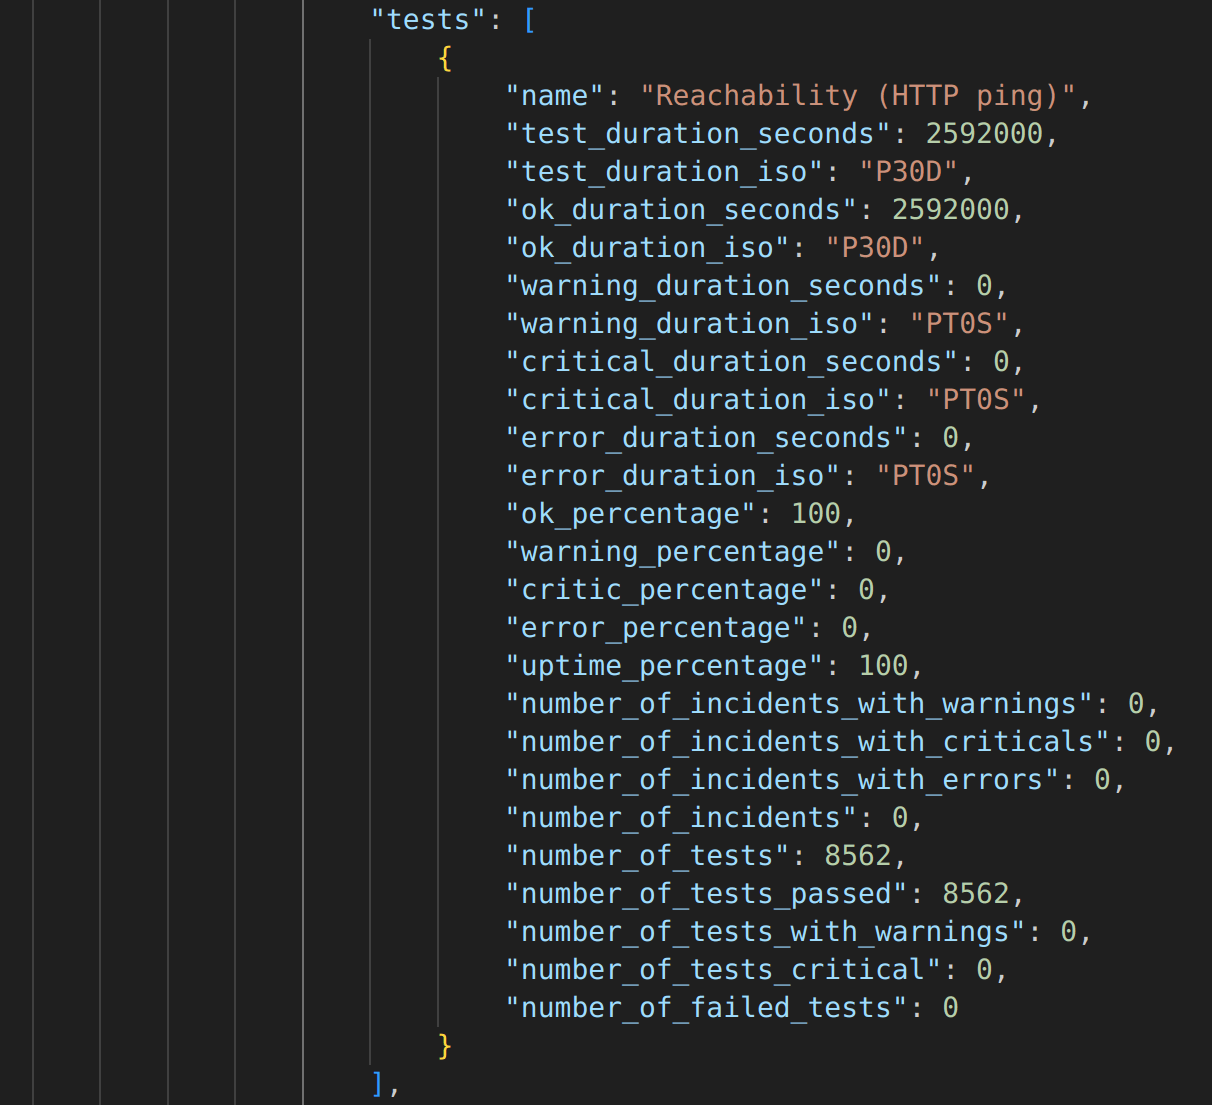
tests: A list of individual checks (for example, HTTP ping, disk usage, queue size, etc.) that includes the same uptime breakdown and test counters.
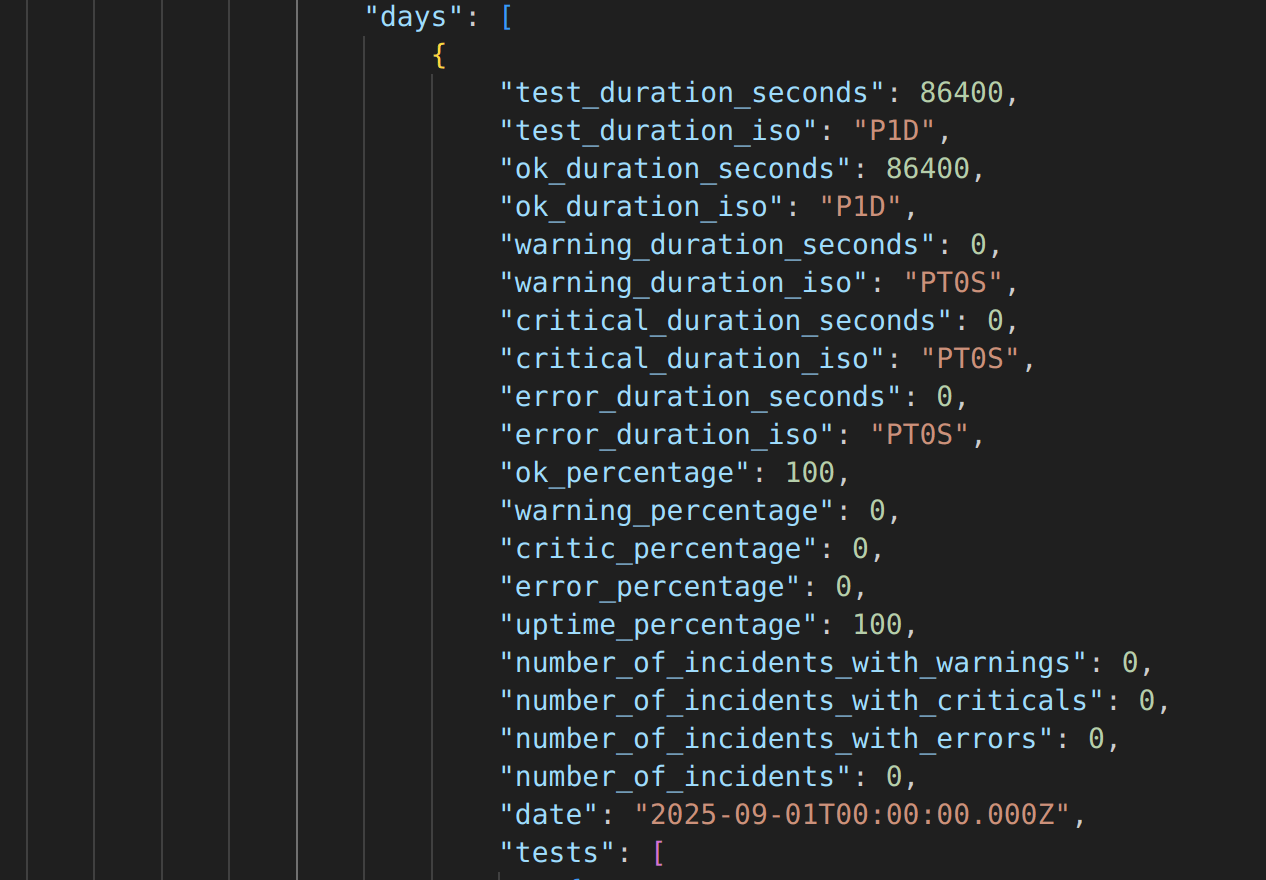
days: When available, this array expands the month into daily snapshots. Each day has the same structure as the monthly summary, letting you zoom in on a specific date.
Test details
Within both the monthly and daily tests arrays, you will find:
name: The human-readable label of the check.- Duration fields and percentages that mirror those of the parent month or day.
- Counters such as
number_of_tests,number_of_tests_passed, andnumber_of_failed_tests, which apply to metrics that run multiple times per day (especially for server monitors).
If a field is not relevant for a specific test, its value is set to zero. This makes it easy to identify which checks have ever reached a warning or error state.
Tips for working with the export
- Use a JSON viewer or your favorite IDE to collapse sections and quickly navigate between monitors or days.
- Load the file into tools like Power BI, Google Data Studio, or your own scripts to build custom uptime dashboards.
- Because the file includes both seconds and ISO 8601 durations, you can choose whichever format fits your calculations best. No extra conversion is required.
Related guides

QuickStart Beginner’s Guide to Semonto

How to Check Your Website for Broken Links With Semonto

How to Check Your Website for Mixed Content

How to monitor your TLS/SSL certificates

How to monitor server health with Semonto